A Precessing Jet in the CH Cyg Symbiotic System
Abstract
Jets have been detected in only a few symbiotic binaries to date, and CH Cyg is one of them. In 2001, a non-relativistic jet was detected in CH Cyg for the first time in X-rays. We carried out coordinated Chandra, HST, and VLA observations in 2008 to study the propagation of this jet and its interaction with the circumbinary medium. We detected the jet with Chandra and HST and determined that the apex has expanded to the South from 300 AU to 1400 AU, with the shock front propagating with velocity 100 km s-1. The shock front has significantly slowed down since 2001. Unexpectedly, we also discovered a powerful jet in the NE-SW direction, in the X-ray, optical and radio. This jet has a multi-component structure, including an inner jet and a counter-jet at 170 AU, and a SW component ending in several clumps extending out to 750 AU. The structure of the jet and the curvature of the outer portion of the SW jet suggest an episodically powered precessing jet, or a continuous precessing jet with occasional mass ejections or pulses. We carried out detailed spatial mapping of the X-ray emission and correlation with the optical and radio emission. X-ray spectra were extracted of the central source, inner NE counter jet, and the brightest clump at a distance of 500 AU from the central source. We discuss the initial results of our analyses, including the multi-component spectral fitting of the jet-components and of the central source.
1 INTRODUCTION
Symbiotic systems are accreting binaries which are potential progenitors of a fraction of Pre-Planetary and Planetary Nebulae, and of a fraction of SN type Ia (e.g. Chugai Yungelson 2004). CH Cyg is a symbiotic containing mass-losing M6-7 III giant and an accreting white dwarf (e.g. Hinkle et al. 2009). At only 250 pc (Perryman et al. 1997), CH Cyg is one of very few interacting binaries close enough for detailed multiwavelength spatial and spectral studies of the close circumbinary environment (e.g. Corradi et al. 2001, Eyres et al. 2002, Crocker et al. 2002, Ezuka et al. 1998, Mukai et al. 2007, Scopal et al 2007, Pedretti et al., 2009). In 1984 a powerful radio jet was detected in CH Cyg (Taylor at al. 1986) following a sudden dimming of the V magnitude. Similar radio jet-activity was detected in 1998 following another sudden V magnitude dimming in 1996 (Karovska et al. 1998).
CH Cyg, one of a very few symbiotic systems with jet activity also seen in X-rays, was directly imaged for the first time in 2001 using Chandra (Galloway and Sokoloski, 2004, Karovska et al. 2007). Karovska et al. (2007) detected multiple components in Chandra images obtained in March 2001, including a loop-like structure associated with an expanding jet in the soft (2 keV) image extending 1.5” (375 AU) to the south of the central source. It was also visible in the VLA and HST images. The emission was consistent with optically thin thermal X-ray emission from shocks between the jet and the dense circumbinary material.
In June 2008 we carried out follow-up Chandra, HST, and VLA observations of CH Cyg to monitor the propagation of the 2001 X-ray jet. We detected the 2001 jet with Chandra and HST as it has expanded in the circumbinary environment, and discovered powerful, jet activity at X-ray, radio, and optical wavelengths. In §2 we describe the observations and analyses, and the initial results are summarized in §3. We discuss the results in §4.
2 OBSERVATIONS AND ANALYSIS
Chandra observations of CH Cyg were carried out on 2008 June 8-10 (ObsIDs 8972, 9867, and 9868) obtaining 80 ks of data (Table 1) with ACIS-S3 (Weisskopf et al. 2002). We analyzed the observations using CIAO111Chandra Interactive Analysis of Observations system package (http://cxc.harvard.edu/ciao) 4.1 and CalDB version 4.1.1 We merged all ObsIDs, using ObsID 9867 as the coordinate reference. Source and background spectra were extracted by standard methods following CIAO threads. The spatial distribution of the X-ray emission was explored using sub-pixelated images (0.1”/pixel) and PSF simulations and deconvolution techniques, taking advantage of the telescope dither, which provides access to smaller spatial scales than the ACIS pixel (0.492”) as the image moves across the detector pixels. Similar techniques were applied for resolving the CH Cyg jet in 2001 (Karovska et al. 2007), the Mira AB symbiotic binary system (Karovska et al. 2005), substructures in NGC6240 (Esch et al 2004), and SN1987A (e.g. Burrows et al. 2000, Park et al. 2002). We applied a statistical deconvolution technique, EMC2, specifically applicable to low-counts Poisson data (Esch et al. 2004; Karovska et al. 2005, 2007). The deconvolution was performed using simulated Chandra ChaRT222http://asc.harvard.edu/chart/index.html PSFs (Karovska et al. 2003).
We carried out HST observations on 2008 June 9 using WFPC2 with the filters listed in Table 1. A 4-point dither pattern was used in each filter to better sample the PSF and for improved cosmic-ray rejection. The central region of the CH Cyg system was located at the edge of the WF2 chip which has a resolution of 0.0996” per pixel. All images were calibrated using the standard pipeline calibrations (vis Baggett et al., 2002). The four exposures for each filter were combined together at a plate-scale of 0.05” per pixel using MultiDrizzle (Koekemoer et al. 2002). Model PSFs derived from (http://www.stsci.edu/software/tinytim/) allowed identification of features related to the PSF itself.
On 2008 October 4, we obtained VLA observations (A configuration) at 5 GHz, 8 GHz (3 hours each, 2 hours on source), and at 1.4 GHz (1 hour). At 5 GHz we detected a total flux density from the source of 4.6 mJy, with a peak surface brightness of 1.33 mJy beam-1. The peak surface brightness at 8 GHz and 1.4 GHz was 1.71 mJy beam-1, and 1.4 mJy beam-1, respectively. We achieved a resolution of FWHM = at 5 GHz, at 8 GHz, and at 1.4 GHz, reaching an RMS sensitivity of 19 Jy at 5 GHz and 21 Jy at 8 GHz, and 60Jy at 1.4 GHz. The data were analyzed using standard calibration and analysis procedures, including photometry and spectral diagnostics of detected components (as in Karovska et al. 2007).
3 INITIAL RESULTS
The 2008 observations showed a central source and two jets; the “old” (2001) jet in the SE direction, and a new jet in the SW/NE direction. In the following we present the initial results from the Chandra, HST and VLA imaging and X-ray spectroscopy.
1. Imaging
Old Jet
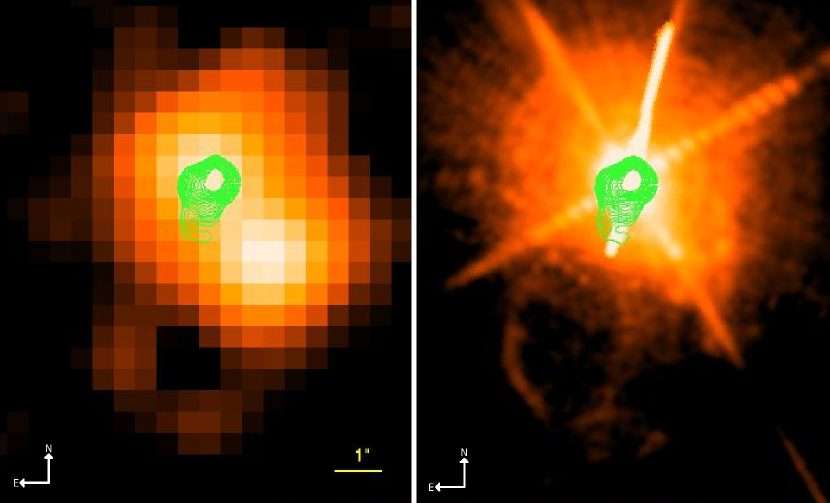
Figure 1 (left panel) displays the 2008 Chandra image showing the “old” SE jet; a loop-like structure extending south of the central source at PA =175∘ to a distance of 5.6” (1400 AU). About 90 counts were detected, with a hardness ratio ( hereafter HR, counts 0.2-2 keV/ counts 2-8 keV).
The “old” SE jet was also detected in the 2008 HST H image, as shown in Figure 1 (right panel), at about the same position as in the Chandra image. The color levels emphasize the extended loop structure rather then inner structures associated with the new jet. below. The loop morphology is very similar in the HST and Chandra images and structures appear co-spatial. However, there may be a spatial displacement between the structures, limited by the size of the ACIS-S pixel size of 0.492”. To show the expansion of the jet since 2001 we overlaid on the 2008 Chandra and HST images the contours of the X-ray image obtained in 2001 (ObsID 1904) showing the “old” jet loop-like structure at 1.5”.
The loop structure is likely due to a shock front propagating through the extended circumbinary material. The loop is clearly detected only in H and [S II], indicating emission from a shock slower than 100 . Assuming a linear expansion since 2001, the average velocity of the jet would be 700 . However, if the 100 shock is representative of the current expansion velocity of the jet apex, then the initial speed of the jet may have been much higher, exceeding 1000 , and the jet has slowed down during its propagation in the circumbinary medium.
New Jet
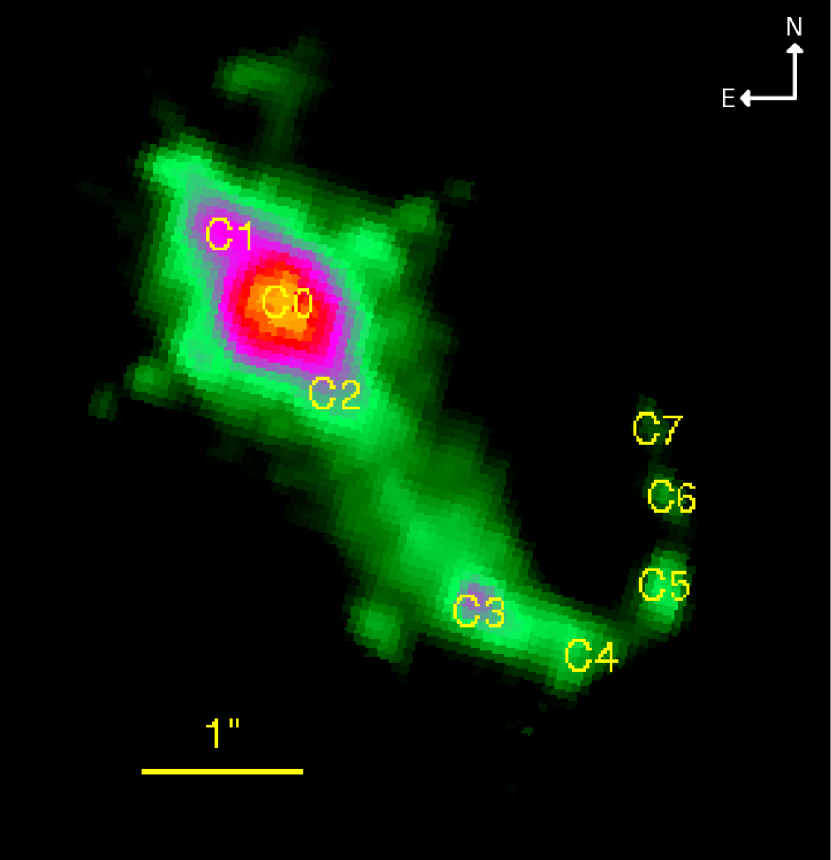
Figure 2 displays the F502N (5007 Å [OIII]) HST image showing the central source region (C0) and the components of the new jet. An inner SW jet and a NE counter-jet (C2 and C1, respectively), both extend to about 1” from the central source, and a fainter narrow structure extends to the SW. It reaches a bright knot (C3) at 2” with P.A. of 215∘ , then expands into a hook-like structure. The hook-like structure contains several bright clumps as it curves 2.5-3” toward the West. The bright C3 clump dominates the emission from the hook-like structure. It is observed clearly at F502N ([OIII]) and in the other HST filters except for F547M and F673N ([S II]). The absence of emission from the lowest ionization material suggests photoionized gas or a shock in which recombination is incomplete (Raymond et al. 1988).
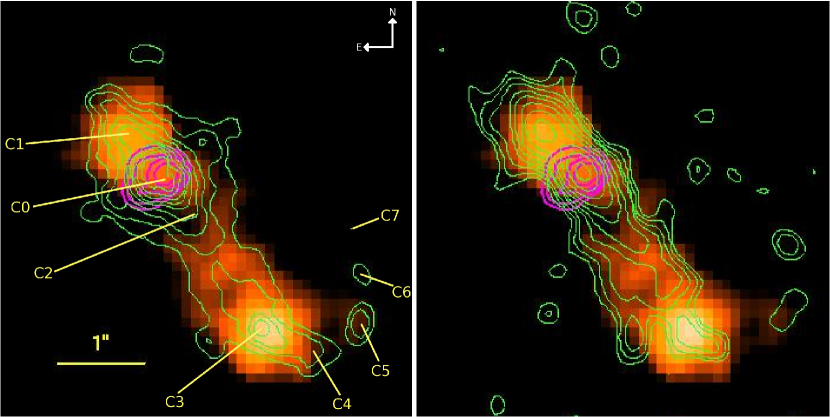
Several of the structures in the HST images were also detected in the Chandra images. These include the central source, the SW inner jet, the NE inner counter-jet, and the clump C3. A bridge-like structure is seen between the inner jet and the clump C3, and possibly emission associated with C4 and C5. The structures in the new jet are bright enough for sub-pixel analysis using the information on the photon positions (vis Karovska et al. 2005). We created energy-filtered images in the soft 0.2-2keV band, medium 2-4 keV band, hard 4-6 keV band and in the 6-7 keV band (encompassing the strong 6.67 keV Fe line). The NE inner counter-jet (C1) is clearly detected in the Chandra images, with a hardness ratio HR=0.15. The brightness of C3, which dominates the soft X-ray emission from the system below 2 keV, drops quickly at energies 2 keV. The HR is 0.05. Figure 3 shows the deconvolved Chandra 0.2-2 keV image, overlaid with contours of the 6-7 keV image. For comparison we also show the overlaid contours of the F502N HST image (Fig. 3 left panel) and of the VLA 5 GHz image (Fig 3 right panel). At the 0.2” resolution, the Chandra emission appears co-spatial with the HST F502N emission in C0, C1, and C3.
The central source, the SW inner jet, the NE inner counter-jet, and a portion of the hook-like structure are also seen in the VLA 1.4 GHz, 5 GHz, and 8 GHz maps. There is a faint elongated blob in the 5 GHz map corresponding to the C3 region (Figure 3 right panel). However, no significant radio emission is seen at C3 at 8 GHz. Very faint emission close to the C4, and C5 knots is detected in the 5 GHz map.
The radio jet is clearly resolved in both width and length (3” long, 1” wide). The integrated emission shows roughly flat spectrum from 1.4 to 8 GHz consistent with optically thin free-free emission. The southern loop (leaving out the core + core-jet on a scale of 0.5”) has an integrated radio flux of 1.4 mJy at 5 GHz and 2.0 mJy at 8 GHz. From the radio flux density and morphology, we estimate the following mean values over the source: ionized gas density 1.5 104 cm (assumed temperature 1 104 K), pressure 3 108 K cm (or 4 10-8 dyn cm). We find the HII mass to be 5 10-6 M, and the emission measure to be 6.7 105 pc cm-6.
The Central Source
A bright central source is detected in all images. It appears to be resolved, and possibly elongated in the direction perpendicular to the new jet. The central source is fainter than C3 in the soft 0.2-2 keV band, but appears bright at harder wavelengths, including the Fe emission at 6-7 keV. We also detected variable X-ray emission from the central source. Further analysis is underway in determining the nature of the extended emission and the variability.
2. X-ray Spectroscopy
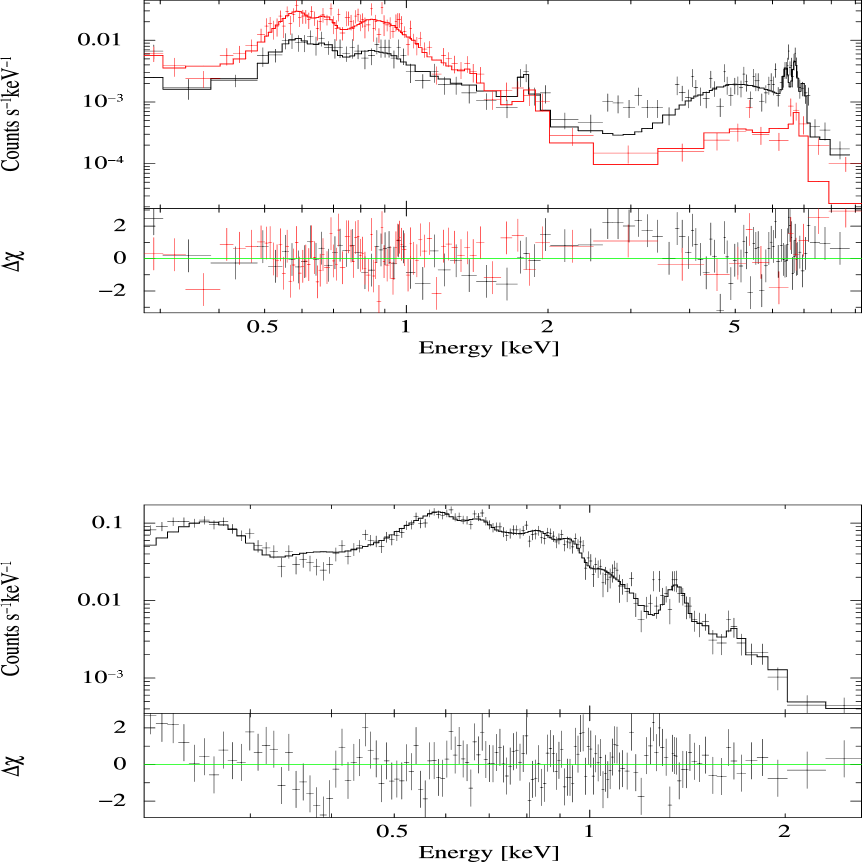
Figure 4 shows the spectra extracted in three main regions, non-overlapping ellipses centered on: (1) the central C0 source, (2) the inner NE counter-jet source C1, and (3) the bright SW clump C3 (see Fig.3). The spectra were grouped to a minimum of 10 counts per bin, and the fits were performed using Xspec 12.5.0333Xspec is an X-ray spectral fitting package (http://heasarc.gsfc.nasa.gov/docs/xanadu/xspec/) using the statistic and “churazov” weighting. The spectra for the three extraction regions differ markedly. All three regions show significant soft emission ( keV).
In C3, the spectrum falls off sharply above , characteristic of a soft thermal spectrum, but also has significant, very soft emission (–0.4 keV). We fit this spectrum with a combination of absorbed (tbabs) thermal (vapec) models. C0 and C1, also show significant hard emission and prominent Fe-K lines. The hard emission is very strong in region C0, and relatively weaker in region C1. Because the source regions are very close in projection, some emission from each region (from the wings of the PSFs) contaminates the extracted spectrum in the other. We assume that the hard spectrum originates entirely from region C0 and the soft emission entirely from region C1, but that smearing by the PSF wings mixes fluxes from the two sources. We fit the spectra simultaneously. Each component is modeled as a combination of absorbed thermal components, with a scaled fraction of each spectrum contributing to the other spectrum. In the fit to region C0, the soft components are scaled by , while in region C1, the hard component (and the Gaussians) are scaled by .
The soft components were fitted by relatively unabsorbed soft thermal models ( 0, keV, and , ). To better account for the intermediate energy flux, and for the hard component, we used a partial covering absorber () model. The resulting model for the hard component required a hot () very heavily absorbed () thermal model with % coverage fraction. The leakage with the partial covering model significantly improved the fit at intermediate energies, but a systematic excess remains for C0; this will be explored in a follow up paper. The large covering factor suggests that K emission from low ionization states should be present, and indeed features at 6.4keV and keV corresponding to Fe K and Si K are detected. Although the model for the hard component produced significant Fe-K emission, the very large residuals indicated that at least one additional line component is needed. This was implemented as a “zero-width Gaussian” (i.e., a Gaussian with negligible width compared to the instrumental resolution) at 6.4 keV, consistent with neutral or low ionization Fe. In the C0 spectrum, a prominent line-like feature at keV is consistent with Si-K emission from neutral or low-ionization Si.
The C3 X-ray spectrum appears to be mainly from a thermal plasma, with O, Ne, and Fe-L line emission (0.5–1 keV), and a prominent Mg XI line feature at 1.34 keV. We fit the spectrum with absorbed (tbabs) thermal (vapec) plasma models. In order to match the spectrum at very soft (), intermediate (1-2 keV) and harder () energies, we needed three thermal components with , , and ; the fitted absorption was effectively zero. Fits with pure solar abundances did not fit well (particularly the Mg XI line feature at 1.34 keV), so the abundances of O, Ne, Mg, and Fe (= Ni) were allowed to vary (but with the same values for each of the thermal components). The fitted [Fe] and [Ne] abundances were effectively solar (Anders & Grevesse 1989 abundances); [O] was low (), while [Mg] was very high (). The resulting residuals suggested a line-like feature at about 1.66 keV; it may be due to excess Mg XII emission, beyond what is predicted by the three component thermal model.
4 DISCUSSION
The hard emission component from the central region, C0, observed in 2008 shows a striking resemblance in both temperature and high absorbing column to the hard emission observed in 2001 (Galloway & Sokoloski 2004). This indicates that the hard emission originates close to the accretor and may be associated with the boundary layer of the accretion disk or a bright spot (Kennea at al. 2009). The emission from this region is heavily absorbed by a partial covering absorber, with a small “leakage” accounting for some soft emission. The absorbing material could be related to the ejecta close to the accreting source or to the accretion disk, and may be associated with the material in the inner jet. The soft emission near the center at C1 is generally similar to the emission at C3, but it is more difficult to characterize because of the blending with radiation from C0. We suggest that it arises from the same mechanism, shock waves driven into the ambient gas by the jet.
The new jet activity is likely a result of an ejection following the strong dimming of the light curve of CH Cyg in the second half of 2006 (eg. Skopal et al. 2007). Taranova and Shenavrin (2007) found evidence for dust formation in CH Cyg which resulted from a mass ejection in the close circumbinary region associated with the 2006 light dimming event. The light curve is very similar to the 1984 and 1996 dimming events after which jets were detected in radio and optical wavelengths. Assuming that the “new” jet was ejected in the second half of 2006, and a linear expansion, the velocity could be over 1500 km/s.
The SW inner jet and the NE inner counter-jet are located within 1” (250 AU) from the central source, which is significantly smaller than the 3′′ (750 AU) SW portion of the jet. It is possible that this is the inner part of a continuous precessing jet, since a similar elongated structure, extending to 0.7” at PA =330∘, and fainter structure to the south at about same distance from the central source at PA = 150∘ were detected in the Chandra images from 2001 (vis Fig. 5 in Karovska et al. 2007).
The inner jet and the inner counter-jet may be running into a shell of dust at 1” from the central source, which was detected by Biller et al. (2006). Biller et al. showed that the dust shell is significantly denser to the N, which could account for the difference in brightness of the C1 and C2 structures, if they are indeed a result of an interaction of the jet with the dust shell. After encountering the dust shell, the inner jet (C2) is then continuing to the SW, while the inner counter-jet (C1) is slowed down significantly by the denser shell to the N.
The curved appearance of the outer portion of the SW jet and the observed clumps is consistent with an episodically powered precessing jet or a continuous jet with occasional mass ejections, or pulses ( Crocker et al. 2002; Stute and Sahai 2007). The clumps, including the dominant C3 structure, may be shocked ejecta interacting with the circumbinary material (eg. with mass loss from the red giant and/or with previously ejected material). We note that similar precessing jet-like outflows have been found in Pre-Planetary and Planetary nebulae (e.g. Sahai and Trauger; 1998; Soker, 2002; Sahai et al. 2005), a fraction of which possibly evolve from symbiotic binaries like CH Cyg.
The fits to the C3 X-ray spectrum give temperatures corresponding to 400 to 1200 shocks. The spectral extraction region corresponds to a length scale of cm. If the line of sight depth of the region is comparable in size, the X-ray fit normalizations would imply densities of 1200, 1000, and 450 for the soft, medium, and hard components, respectively. The total internal energy would then be .
In summary, we presented the initial results from the analysis of the 2008 Chandra, HST, and VLA observations of the CH Cyg system including the detection of the ”old” 2001 jet which has expanded to a distance of 1400 AU to the SE, and a discovery of a new jet extending to 750AU to the SW. We discussed the initial results from the multi-wavelength imaging and X-ray spectroscopy.
References
- Anders & Grevesse (1989) Anders, E., & Grevesse, N. 1989, Geochim. Cosmochim. Acta, 53, 197
- Baggett (2002) Baggett, S., et al. 2002, in HST WFPC2 Data Handbook, v. 4.0, ed. B. Mobasher, Baltimore, STScI
- Biller et al. (2006) Biller, B. A., et al. 2006, ApJ, 647, 464
- Burrows et al. (2000) Burrows, D. N., et al. 2000, ApJ, 543, L149
- Chugai & Yungelson (2004) Chugai, N. N., & Yungelson, L. R. 2004, Astronomy Letters, 30, 65
- Corradi et al. (2001) Corradi, R. L. M., Munari, U., Livio, M., Mampaso, A., Gonçalves, D. R., & Schwarz, H. E. 2001, ApJ, 560, 912
- Crocker et al. (2002) Crocker, M. M., Davis, R. J., Spencer, R. E., Eyres, S. P. S., Bode, M. F., & Skopal, A. 2002, MNRAS, 335, 1100
- Eyres et al. (2002) Eyres, S. P. S., et al. 2002, MNRAS, 335, 526
- Esch et al. (2004) Esch, D. N., Connors, A., Karovska, M., & van Dyk, D. A. 2004, ApJ, 610, 1213
- Ezuka et al. (1998) Ezuka, H., Ishida, M., & Makino, F. 1998, ApJ, 499, 388
- Galloway & Sokoloski (2004) Galloway, D. K., & Sokoloski, J. L. 2004, ApJ, 613, L61
- Hinkle et al. (2009) Hinkle, K. H., Fekel, F. C., & Joyce, R. R. 2009, ApJ, 692, 1360
- Karovska et al. (1998) Karovska, M., Carilli, C. L., & Mattei, J. A. 1998, Journal of the American Association of Variable Star Observers (JAAVSO), 26, 97
- Karovska et al. (2005) Karovska, M., Schlegel, E., Hack, W., Raymond, J. C., & Wood, B. E. 2005, ApJ, 623, L137
- Karovska (2003) Karovska, M. 2003, Chandra News, 10, 20
- Karovska et al. (2007) Karovska, M., Carilli, C. L., Raymond, J. C., & Mattei, J. A. 2007, ApJ, 661, 1048
- Kennea et al. (2009) Kennea, J. A., Mukai, K., Sokoloski, J. L., Luna, G. J. M., Tueller, J., Markwardt, C. B., & Burrows, D. N. 2009, ApJ, 701, 1992
- Koekemoer et al. (2002) Koekemoer, A. M., Fruchter, A. S., Hook, R. N., & Hack, W. 2002, The 2002 HST Calibration Workshop : Hubble after the Installation of the ACS and the NICMOS Cooling System, 337
- Mukai et al. (2007) Mukai, K., Ishida, M., Kilbourne, C., Mori, H., Terada, Y., Chan, K.-W., & Soong, Y. 2007, PASJ, 59, 177
- Park et al. (2002) Park, S., Burrows, D. N., Garmire, G. P., Nousek, J. A., McCray, R., Michael, E., & Zhekov, S. 2002, ApJ, 567, 314
- Pedretti et al. (2009) Pedretti, E., et al. 2009, MNRAS, 397, 325
- Perryman et al. (1997) Perryman, M. A. C., et al. 1997, A&A, 323, L49
- Raymond et al. (1988) Raymond, J. C., Hester, J. J., Cox, D., Blair, W. P., Fesen, R. A., & Gull, T. R. 1988, ApJ, 324, 869
- Sahai & Trauger (1998) Sahai, R., & Trauger, J. T. 1998, AJ, 116, 1357
- Sahai et al. (2005) Sahai, R., Le Mignant, D., Sánchez Contreras, C., Campbell, R. D., & Chaffee, F. H. 2005, ApJ, 622, L53
- Skopal et al. (2002) Skopal, A., Bode, M. F., Crocker, M. M., Drechsel, H., Eyres, S. P. S., & Komžík, R. 2002, MNRAS, 335, 1109
- Skopal et al. (2007) Skopal, A., Vaňko, M., Pribulla, T., Chochol, D., Semkov, E., Wolf, M., & Jones, A. 2007, Astronomische Nachrichten, 328, 909
- Soker (2002) Soker, N. 2002, ApJ, 568, 726
- Stute & Sahai (2009) Stute, M., & Sahai, R. 2009, A&A, 498, 209
- Taylor et al. (1986) Taylor, A. R., Seaquist, E. R., & Mattei, J. A. 1986, Nature, 319, 38
- Taranova & Shenavrin (2007) Taranova, O. G., & Shenavrin, V. I. 2007, Astronomy Letters, 33, 531
- Weisskopf et al. (2002) Weisskopf, M. C., Brinkman, B., Canizares, C., Garmire, G., Murray, S., & Van Speybroeck, L. P. 2002, PASP, 114, 1
| Chandra ACIS-S: | ||||||||||||||||||||||||
|
||||||||||||||||||||||||
| HST WFPC2: | ||||||||||||||||||||||||
|
||||||||||||||||||||||||
| VLA A-Configuration: | ||||||||||||||||||||||||
|