Structural distortions and model Hamiltonian parameters: from LSDA to a tight-binding description of LaMnO3
Abstract
The physics of manganites is often described within an effective two-band tight-binding (TB) model for the Mn electrons, which apart from the kinetic energy includes also a local “Hund’s rule” coupling to the core spin and a local coupling to the Jahn-Teller (JT) distortion of the oxygen octahedra. We test the validity of this model by comparing the energy dispersion calculated for the TB model with the full Kohn-Sham band-structure calculated within the local spin-density approximation (LSDA) to density functional theory. We analyze the effect of magnetic order, JT distortions, and “GdFeO3-type” tilt-rotations of the oxygen octahedra. We show that the hopping amplitudes are independent of magnetic order and JT distortions, and that both effects can be described with a consistent set of model parameters if hopping between both nearest and next-nearest neighbors is taken into account. We determine a full set of model parameters from the density functional theory calculations, and we show that both JT distortions and Hund’s rule coupling are required to obtain an insulating ground state within LSDA. Furthermore, our calculations show that the “GdFeO3-type” rotations of the oxygen octahedra lead to a substantial reduction of the hopping amplitudes but to no significant deviation from the simple TB model.
pacs:
I Introduction
Manganite systems, MnO3, where is a trivalent rare earth cation (e.g. La3+, Pr3+, Nd3+, …) and is a divalent alkaline earth cation (e.g. Sr2+, Ca2+, …), have attracted the attention of scientists already for decades.Jonker and Van Santen (1950); Wollan and Koehler (1955); Coey et al. (1999); Tokura (2000); Dagotto et al. (2001) These compounds exhibit a very rich phase diagram as a function of both temperature and composition, with various types of eventually coexisting charge, orbital, and magnetic order, and they are therefore important prototype materials to test our current understanding of correlated electron systems. In addition, the observation of “colossal magneto-resistance”,Jin et al. (1994) a magnetic-field induced change in electric resistivity by several orders of magnitude, has spawned further interest both in the fundamental physics behind this effect as well as in the question of whether this effect can be utilized for technological applications.
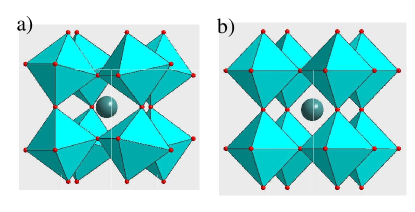
LaMnO3, the parent material for many manganite systems, exhibits an orthorhombically distorted perovskite structure with space group (see Fig. 1a).Elemans et al. (1971) The observed deviation from the ideal cubic perovskite structure (shown in Fig. 1b) involves both Jahn-Teller (JT) distortions of the oxygen octahedra surrounding the Mn cations,Kanamori (1960) as well as a collective tilting of these octahedra, the so called “GdFeO3-type” distortion.Woodward (1997) The magnetic moments of the Mn cations in LaMnO3 order at K in a so-called “A-type” antiferromagnetic structure,Wollan and Koehler (1955) with parallel alignment of all moments within a certain (001) plane and antiparallel alignment of the moments between adjacent planes.
In the ideal cubic perovskite structure (see Fig. 1b) the 3 states of the Mn cations are split by the crystal field into the lower-lying three-fold degenerate states and the higher-lying two-fold degenerate states. In LaMnO3 the majority-spin states are fully occupied, whereas the two majority-spin levels are filled with only one electron, according to the formal high-spin electron configuration of the Mn3+ cation.
The theoretical modeling of manganite systems is usually based on the assumption that the important low energy dynamics of these systems can be described within an effective two band tight-binding (TB) model for the Mn electrons. In this model, electrons can hop between the orbitals at neighboring Mn sites, and the corresponding kinetic energy term in the Hamiltonian is eventually complemented by local terms describing the coupling to the “core spin”, the coupling to the JT distortion of the surrounding oxygen octahedron, and the electron-electron interaction. These models can account for many of the properties observed in manganite systems (see Ref. Dagotto et al., 2001 for a recent review). Reasonable values for the model parameters, which describe the strengths of the various competing interactions, can be inferred from experiments. Nevertheless, it is very desirable to independently calculate values for these parameters based on fundamental “first principles” theory. Evaluating the models using such independently determined parameters provides a stringent test for the accuracy of the model description.
Electronic structure calculations based on density functional theory (DFT) Hohenberg and Kohn (1964); Kohn and Sham (1965) provide a way to study the ground state electronic structure of a specific material without having to resort to model assumptions, and therefore provide a good starting point for the derivation of more simplified models and their parameters (see e.g. Refs. Gunnarsson et al., 1989 and Hybertsen et al., 1989). The electronic structure of LaMnO3 has been studied previously within the local spin density approximation (LSDA) to DFT and by using the LSDA+ method.Pickett and Singh (1996); Satpathy et al. (1996); Solovyev et al. (1996); Terakura et al. (2000) It was shown that many properties such as the correct magnetic ground state and even some spectral properties are well described by these methods, provided the correct experimental crystal structure is used in the calculation.
Although the model treatment of manganite systems usually employs a pure electron description, it is generally understood that the electron hopping between the states on neighboring Mn sites is truly an effective hopping which is mediated by the intermediate oxygen anions via - or - hopping. The resulting bands with predominant character can be described by an effective two-band model if the Mn states are energetically separated from the oxygen and states. In this case, the effective nearest neighbor hopping amplitude between the Mn states is (to leading order) given by:
| (1) |
Here, is the hopping amplitude between the Mn and the oxygen states, and are the energies of the corresponding ionic levels, and for simplicity we have neglected hopping via the oxygen states.
The JT distortion changes the Mn-O bond lengths while the octahedral tilts change the bond angles; thus both distortions affect the overlap integrals which determine the hopping amplitude . It is therefore not clear a priori that a simple effective TB model with fixed (distortion-independent) hopping amplitudes can be used to study the effects of lattice distortions in manganite systems.
Here, we use the Kohn-Sham band-structure calculated within the LSDA as a reference for the non-interacting TB model, and we analyze how well the relevant part of the energy dispersion of LaMnO3 can be fitted within an effective two-band TB model for the electrons. In particular, we analyze the effects of the two dominant structural distortions in LaMnO3, the JT distortion and the GdFeO3-type rotations, and we address the question of whether magnetic and orbital (JT) order affects the effective hopping amplitudes.
The result of our analysis is that the effective two-band model gives a good fit of the -projected Kohn-Sham band-structure, provided that hopping between both nearest and next-nearest neighbors is taken into account. We show that the same hopping amplitudes can be used for the ferromagnetic, the A-type antiferromagnetic, and the JT distorted case, so that the simple two-band TB model can be used to study the effects of JT distortions. Furthermore we quantify the dependence of the hopping amplitudes on volume changes and on GdFeO3-type rotations. The latter lead to significant reductions of the hopping amplitudes ( 25 % for the experimental structure) relative to the ideal cubic structure with the same unit cell volume. The hopping amplitudes corresponding to the observed bond angles should therefore be used in theoretical modeling.
Our results also provide a quantitative determination of the JT and Hund’s rule couplings. The result for the Hund’s coupling is consistent with previous work; the JT coupling is considerably smaller than previous estimates.Ahn and Millis (2000); Popovic and Satpathy (2000); Yin et al. (2006) We find that both the JT and Hund’s coupling are required to stabilize the insulating state within LSDA.
Our conclusions rely in an essential way on the energy separation of the transition metal -bands and the oxygen -bands; methods such as LSDA+ which shift the energy of the transition-metal -bands relative to the energy of the oxygen -bands can produce a band structure that is very poorly described by a simple two-band TB model.
The remaining part of this paper is organized as follows. Sec. II contains a brief summary of the methods and technical details of our work. We first describe the method we use for our LSDA calculations, then specify the TB Hamiltonian, and finally describe how we decompose the various structural distortions found experimentally in LaMnO3. Our results are discussed in Sec. III, and we end with a summary of our main conclusions and implications for future work.
II Methods and technical details
II.1 Computational method
We calculate the LSDA Kohn-Sham band-structure for LaMnO3 with both ferromagnetic and A-type antiferromagnetic order in various structural modifications using the projector augmented-wave (PAW) method implemented in the “Vienna Ab-initio Simulation Package” (VASP).Blöchl (1994); Kresse and Furthmüller (1996); Kresse and Joubert (1999) We treat the La 5, La 5, and Mn 3 pseudo-core states as valence states, and we use a plane-wave energy cutoff of 400 eV in all our calculations. We employ -centered 666 and 443 -point grids for the calculations corresponding to the simple and quadrupled perovskite unit cells, respectively, and corresponding grids for the structures in which the unit cells are doubled along the direction or within the - plane. These values result in a good convergence of the calculated band-structures.
In order to extract the bands resulting from the Mn states we use the “fatbands” technique, i.e. we assign a weight to each calculated eigenvalue, which is proportional to the amount of Mn character contained in the corresponding Bloch function, and we identify the -derived bands as those containing a non-negligible character.
It has been shown in Ref. Pickett and Singh, 1996 that the LSDA gives a good overall account of the electronic properties of manganite systems, even though the tendency to open up an energy gap between occupied and unoccupied states is underestimated within the LSDA. This is a well-known feature of the LSDA, which results from the inability of the LSDA to correctly account for the strong Coulomb correlations between the rather localized states in transition metal oxides. Such local Coulomb interactions are usually incorporated in the model Hamiltonian via a separate interaction term. In the following we do not include such an interaction term in our model analysis, and thus the corresponding deficiencies of the LSDA do not affect our results (assuming that the separate treatment of local correlations is justified), except for the question related to the energy separation between the Mn and the oxygen states, which is discussed in Sec. IV.
II.2 Model Hamiltonian
In Sec. III we relate the calculated LSDA band-structure to the following TB model, which contains the terms that are typically used for the theoretical modeling of manganite systems (see e.g. Ref. Dagotto et al., 2001):
| (2) |
with
| (3) | ||||
| (4) | ||||
| (5) |
Here, is the annihilation operator for an electron at site in orbital with spin , and the corresponding boldface symbol indicates a pseudo-spinor in orbital space . The orbital indexes 1 and 2 correspond to and orbitals, respectively. are the hopping amplitudes between site and and are the usual Pauli matrices supplemented by the 22 unit matrix. is the normalized core spin of the electrons (), and are the amplitudes of the two JT modes at site that couple to the electrons:
| (6) | ||||
| (7) |
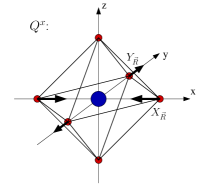
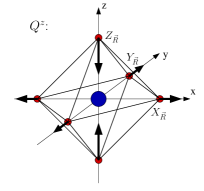
Here, , , and are the displacements along , , and of the oxygen anions that are situated adjacent to the Mn site at in , , and direction, respectively, and only inversion symmetric distortions of the oxygen octahedra are taken into account (see Fig. 2). and are coupling constants for the local interaction terms.
The first term in Eq. (2) describes the hopping between neighboring Mn sites. We will consider hopping between both nearest and next nearest neighbors. Symmetry dictates that the hopping matrices for nearest neighbor hopping are:
| (8) | ||||
| (9) | ||||
| (10) |
and for next nearest neighbor hopping:
| (11) | |||
| (12) | |||
| (13) |
Here, is the lattice constant of the underlying cubic perovskite lattice.
The second and third terms in Eq. (2) describe the Hund’s rule coupling to the core spin and the coupling to the JT distortion of the oxygen octahedra surrounding site , respectively. The normalized core spin is treated as a classical vector which is fixed externally in our model calculations. The values of are given by the positions of the oxygen anions used in our LSDA calculations and are also treated as external parameters in the TB model.
II.3 Structural decomposition
As described in the introduction, LaMnO3 exhibits a strongly distorted perovskite structure with space group .Elemans et al. (1971) The deviation of this structure from the perfect cubic perovskite structure (with space group ) can be decomposed into the following three contributions:
-
(i)
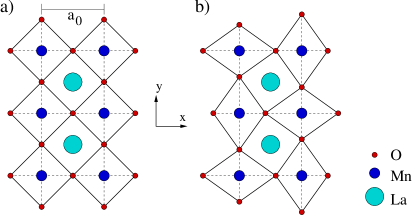
A staggered (checkerboard-like) -type JT distortion of the oxygen octahedra within the - plane, with the long and short axes of neighboring octahedra alternating between the and directions (see Fig. 3). This JT distortion leads to a doubling of the unit cell compared to the ideal cubic perovskite structure, with new “in-plane” lattice vectors and , where is the lattice constant of the original (undistorted) perovskite structure. Identical - planes are stacked on top of each other along the direction. The resulting symmetry is tetragonal.
-
(ii)
“GdFeO3-type” rotations (tilting) of the oxygen octahedra, leading to an additional doubling of the unit cell along the direction, with the new lattice vector , and a reduction to orthorhombic symmetry.
-
(iii)
Displacements of the La cations, and a deformation (strain) of the parallelepiped formed by the lattice vectors , , and , consistent with the orthorhombic crystal class.
We expect that the internal distortions of the oxygen network, i.e. components (i) and (ii) described above, have the largest effect on the bands of LaMnO3 via the ligand-field splitting, whereas the influence of the lattice strain and of the La displacements, i.e. component (iii), can be neglected. We test the validity of this hypothesis in Sec. III.1.
In the following, except for the test calculations presented in Sec. III.1, we therefore consider only components (i) and (ii). This means that we use the “pseudo-cubic” lattice vectors , , and defined above, discarding any orthorhombic strain, and we place the La cations on their ideal positions, corresponding to the perfect cubic perovskite structure. For the internal distortion of the oxygen network, we use the experimental data obtained in Ref. Norby et al., 1995, which we decompose into the pure JT distortion and the GdFeO3-type distortion, as described below. Furthermore, we use a “cubic” lattice constant = 3.9345 Å, which results in the same volume per formula unit as in the experimentally observed structure.Norby et al. (1995)
| O1 | O2 | |||||
| Exp. (Ref. Norby et al., 1995) | -0.0733 | -0.0107 | 0.25 | 0.2257 | 0.3014 | 0.0385 |
| Ideal | 0.0 | 0.0 | 0.25 | 0.25 | 0.25 | 0.0 |
| JT | 0.0 | 0.0 | 0.25 | 0.2636 | 0.2636 | 0.0 |
| GFO | -0.0733 | -0.0107 | 0.25 | 0.2122 | 0.2879 | 0.0385 |
| -0.0733 | -0.0107 | 0.0 | -0.0243 | 0.0514 | 0.0385 | |
| 0.0 | 0.0 | 0.0 | 0.0136 | 0.0136 | 0.0 | |
| -0.0733 | -0.0107 | 0.0 | -0.0379 | 0.0379 | 0.0385 |
Table 1 lists the Wyckoff positions for the two inequivalent oxygen sites O1 and O2 in the experimentally determined structure,Norby et al. (1995) and how we decompose the corresponding structural distortion in the pure JT component (i) and the GdFeO3-type distortion (ii). The decomposition is such that and is orthogonal to , where , , and are the full experimental distortion and its decomposition into pure JT and GdFeO3-type distortion, respectively. Since the Wyckoff coordinates , , and can be directly interpreted as the coordinates relative to the lattice vectors , , and , it follows that in the purely JT distorted structure each oxygen anion O2 is displaced by Å. According to Eq. (6) this corresponds to a JT amplitude of .
III Discussion of results
III.1 Test of structural decomposition
In the previous section we stated that only components (i) and (ii), i.e. the internal distortion of the oxygen network, are important for the bands in LaMnO3, and that the lattice strain as well as the displacements of the La cations are negligible. In order to test this hypothesis, we now compare the LSDA band-structure calculated for the full experimental structure of Ref. Norby et al., 1995 with the one calculated for the slightly simplified structure described above, where the lattice strain and the La displacements are set to zero, while the internal coordinates of the oxygen anions are the same as observed experimentally.
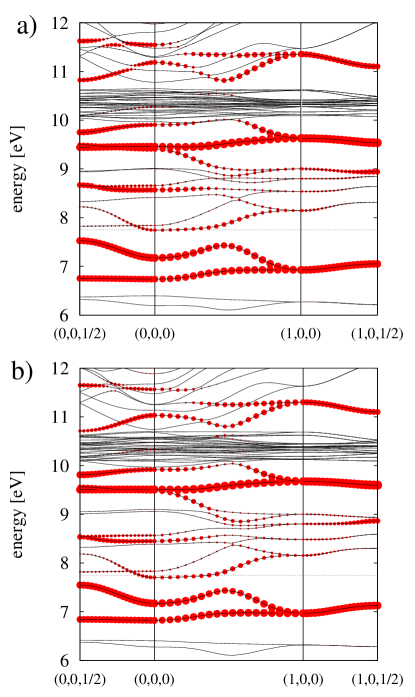
The corresponding LSDA band-structures in the energy range of the Mn bands calculated for A-type antiferromagnetic ordering are shown in Fig. 4 along certain high symmetry directions of the orthorhombic Brillouin zone. The Mn bands are visualized by dots along the bands, with the radius of the dots proportional to the amount of Mn character contained in the corresponding Bloch-function. It is clearly seen that the band-structures obtained for the fully experimental structure and for the simplified structure with only the oxygen distortions included are nearly indistinguishable, with only small deformations of the energy bands resulting from the orthorhombic strain and the La displacements. This validates our initial hypothesis, and in the following we therefore analyze only the effect of the internal structural distortion of the oxygen octahedra on the dispersion of the bands.
We point out that by setting the lattice strain to zero we also neglect any homogeneous -type JT distortion. The good agreement between the two band-structures shown in Fig. 4 thus also indicates that there is no noticeable effect of on the electronic band-structure of LaMnO3 in its experimental crystal structure.
The simplified structure that gives rise to the LSDA band-structure shown in the bottom part of Fig. 4 results from the superposition of distortions (i) and (ii) (described above) of the oxygen network. In the following we will first establish the band-structure of LaMnO3 in the ideal cubic perovskite structure and then separately introduce either the JT distortions, component (i), or the GdFeO3-type rotations, component (ii), and analyze the corresponding effects on the bands.
III.2 Cubic structure
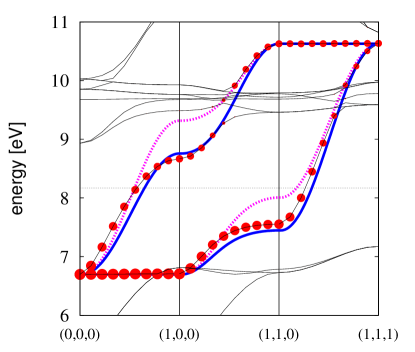
Fig. 5 shows the calculated LSDA energy dispersion around the Fermi-level, calculated for ferromagnetic cubic LaMnO3 in the undistorted cubic perovskite structure with = 3.9345 Å. Only the majority spin bands are shown. Within the TB model defined in Eq. (2), the Hund’s coupling simply splits the spin majority and minority bands rigidly by for a ferromagnetic arrangement of the core spins, and we therefore discuss only the majority spin bands in the following. The Mn bands are again visualized by the dots along the bands in Fig. 5. It is evident that even though the Mn bands are intersected by other bands, the dispersion can be nicely traced along the dots. The bands are about half-filled, as expected from the formal electron configuration of the Mn3+ ion. The bands at 7 eV and lower, just touching the lower range of the bands, are the filled majority Mn bands. The weakly dispersive bands slightly below 10 eV that intersect the Mn bands correspond to the La 4 states, and the strongly dispersive unoccupied bands above the Mn manifold have predominantly La character.
The thick lines in Fig. 5 correspond to fits of the nearest and next nearest neighbor TB models for the bands. The nearest neighbor hopping parameter eV is determined from the full bandwidth eV. The next nearest neighbor hopping parameter is obtained in the following way: In the next nearest neighbor model the width of the energy dispersion of the upper band between -points and is equal to , whereas the dispersion width of the lower band between and is equal to .foo (a) The corresponding energy differences obtained from the LSDA calculation are eV and eV, leading to eV or eV, respectively (and using the previously obtained =0.655 eV). An average value of eV is used for the TB fit in Fig. 5 and in the remaining part of this paper.
It becomes clear from Fig. 5 that the simple nearest neighbor TB model cannot reproduce the LSDA dispersion very well, whereas the next nearest neighbor TB model leads to a very good description of the energy dispersion for all -points.
We point out that a nonmagnetic LDA calculation results in a low-spin electron configuration and the loss of the core spin. Indeed, if we perform a nonmagnetic LDA calculation, the bands are empty and higher in energy compared to the oxygen levels, which in accordance with Eq. (1) results in a reduced bandwidth of 3.546 eV, corresponding to a nearest neighbor hopping amplitude of eV. A nonmagnetic LDA calculation is thus not necessarily a good representation of the electronic structure of the paramagnetic phase, and we therefore use the ferromagnetic state as the starting point for the model analysis. In general, this shows that an LDA+DMFT treatment of LaMnO3 based on a nonmagnetic LDA calculation, such as the one presented in Ref. Yamasaki et al., 2006a, leads to a slight underestimation of the electron hopping.
Next we investigate the influence of A-type antiferromagnetic order. Fig. 6 shows the calculated LSDA band-structure for this case. Note that the underlying crystal structure is still perfect cubic perovskite. Again, the character of the bands is visualized by the dots. The thick lines corresponds to the fit within our antiferromagnetic next nearest neighbor TB model with the hopping parameters obtained from the ferromagnetic case. Due to the doubling of the magnetic unit cell the number of bands is also doubled. A Hund’s-rule parameter eV is obtained from the energy splitting at the point between the two bands at 6.7 eV and 9.4 eV, which show no dispersion along (). This splitting is exactly equal to in the TB model. The value eV is within 2.4 % of the value eV obtained from the ferromagnetic band-structure as the splitting between majority and minority spin states at the point (not shown).
Fig. 6 shows that the two lowest bands are described very well by the antiferromagnetic TB model. The upper two bands show some deviations from the model, especially in the high energy region. This is an inevitable result of the description within a pure band model. As described in Sec. I, the “true” hopping is mediated by the oxygen orbitals and therefore the dispersion depends on the energetic distance from the oxygen levels (see Eq. (1)). This leads to a slight overestimation of the energy dispersion for the high energy states in the pure model. The same effect can also be observed in the ferromagnetic case: Due to their higher energy relative to the oxygen states, the bandwidth of the minority spin bands is smaller than for the corresponding majority spin bands. The nearest neighbor hopping parameter corresponding to the minority spin bands in the ferromagnetic case is eV. In the following we use the value eV, corresponding to the majority spin bands in the ferromagnetic configuration, since this value is representative for the bands close to the Fermi level which determine the important low energy behavior in manganite systems.
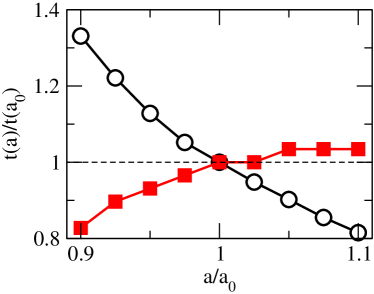
Fig. 7 shows the dependence of both nearest and next nearest hopping parameters on the lattice constant . The nearest neighbor hopping decreases with increasing Mn-O bond length, whereas the next nearest neighbor hopping shows a slight increase. This somewhat unexpected behavior of results from the fact that the energy difference between oxygen and Mn states decreases with increasing volume, and therefore counteracts the effect of the reduced overlap integrals for larger lattice constants.
III.3 Purely JT distorted structure
We now address the effect of the JT distortion of the oxygen octahedra on the bands in LaMnO3. As described in Sec. II.3, we consider only the internal distortions of the oxygen network. This means that we displace the oxygen anions relative to the cubic structure according to the decomposition of the Wyckoff positions described in Table 1 (line “JT”). This results in the staggered arrangement of JT distorted oxygen octahedra shown in Fig. 3b, with the same JT amplitude as in the experimental structure.
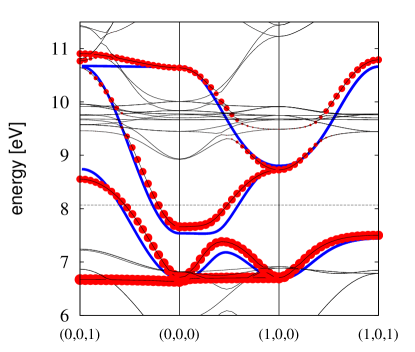
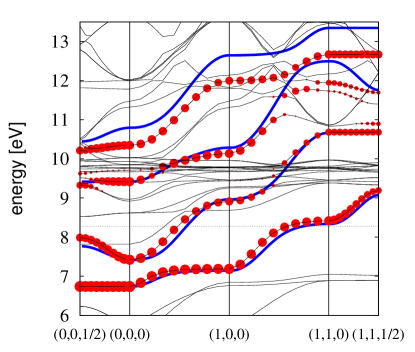
Fig. 8 shows the calculated LSDA majority spin bands for LaMnO3 in the purely JT distorted structure with ferromagnetic spin ordering. Due to the unit cell doubling within the - plane compared to the cubic structure, the two bands corresponding to the -points between and in the ferromagnetic cubic case (see Fig. 5) are “back-folded” between the -points and in the tetragonal Brillouin zone. In addition, the two bands between and in Fig. 5 now correspond to the two upper bands between and in Fig. 8, and the two bands between and in Fig. 8 are now twofold degenerate. It can be seen that the level splitting between the two original states at the point (at 6.7 eV in Fig. 8), which are degenerate in the cubic case, is very small ( 0.08 eV), and that the main effect of the JT distortion is to remove the band crossing between and , resulting from the simple “back-folding” of the cubic band-structure due to the unit cell doubling.
To obtain the value of the JT coupling constant within our TB model, we first determine the -point of the band crossing between and for the case of zero JT distortion. We then determine in the model by fitting the splitting at this -point to the corresponding splitting obtained from the LSDA calculation. In this way we obtain a value of eV, corresponding to eV/Å, since Å (see Sec. II.3). Alternatively we can also fit the small splitting of the two lowest bands at the point by numerically adjusting the JT coupling. In this way we find eV, corresponding to eV/Å, which is within 17 % of the value obtained above. This shows that the extracted coupling strength does not depend critically on the fitting procedure.
The energy dispersion calculated within the TB model using the hopping amplitudes eV and eV obtained for the cubic structure and the JT coupling constant eV/Å obtained in the way described above is compared to the full LSDA band-structure in Fig. 8. It can be seen that the dispersion of the -projected bands is well described within the TB model. Some deviations occur close to the lifted band crossing between and . These deviations are most likely caused by the asymmetry of the Mn-O bonds, which is neglected in the effective TB model. The good overall quality of the TB fit shows that the TB hopping amplitudes are not affected by the presence of the JT distortion. This indicates that the model description with the assumed local coupling of the JT distortion to the levels is justified.
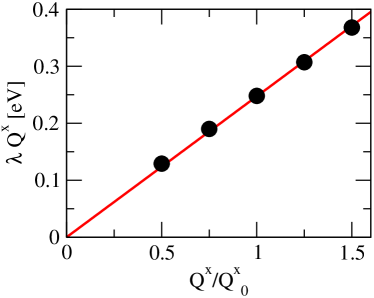
To test whether the linear form of the coupling term within our model is consistent with the density functional theory calculation, and to further test our procedure for obtaining from the LSDA results, we perform additional calculations with different amplitudes of the JT distortion. The results are presented in Fig. 9, where the JT energy is determined by fitting the band-splitting between and . We note that on the ordinate in Fig. 9 should be regarded as the model parameter that we obtain by our fitting procedure, whereas the abscissa characterizes the input structure for our LSDA calculation (relative to the experimentally observed JT distortion ). It is evident that the dependence of on the input distortion is nearly perfectly linear, which indicates the good quality of our fit and the adequacy of the linear coupling term within the model.
It becomes clear from Fig. 8 that the JT distortion in the experimentally observed structure of LaMnO3 has only a weak effect on the dispersion along . This is complementary to the effect of the A-type magnetic order, which strongly suppresses the electron hopping along this direction. The insulating band-structure obtained in LSDA for the fully distorted structure with A-type antiferromagnetic order is therefore a combined effect of both the staggered JT distortion within the - plane and the A-type antiferromagnetism. To achieve an insulating state within LSDA solely due to the JT distortion (i.e. for the ferromagnetic case), would require an unrealistically large JT amplitude. Within our TB model, a value of eV, i.e. more than four times the JT distortion of the experimental structure, is required to open up an energy gap. This is due to the the large value of the hopping and the fact that for staggered JT order does not commute with . The fact that the JT distortion alone is not enough to stabilize an insulating state in LaMnO3 has also been pointed out in Refs. Ahn and Millis, 2000; Yin et al., 2006; Yamasaki et al., 2006b.
One possibility for explaining the insulating character of LaMnO3, as noted by previous authors,Ahn and Millis (2000) is that electron-electron interactions beyond LSDA increase the effective JT splitting, thereby stabilizing the insulating state. To address this we have performed additional LSDA+ calculations (which will be discussed in detail elsewhere). In the LSDA+ method, the interactions between the states of the transition metal cations are treated explicitly on the level of a mean-field Hubbard model.Anisimov et al. (1997) Thereby, a parameter represents the strength of the (screened) on-site Coulomb repulsion between the electrons and a parameter represents the Hund’s coupling. In our LSDA+ calculations we use a slightly simplified approach where only enters.Dudarev et al. (1998)
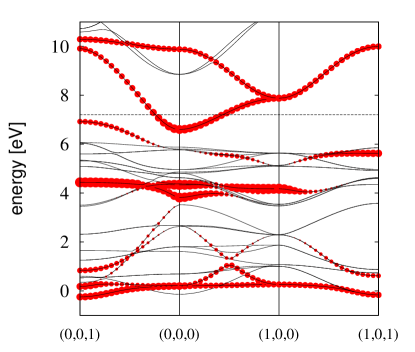
We expect that the on-site Coulomb repulsion enhances the effect of the JT distortion and therefore drives the system towards an insulating state as the value of is increased. However, the calculated LSDA+ band-structure for the purely JT distorted case with and ferromagnetic spin order stays metallic even for a rather large Hubbard parameter of eV (see Fig. 10). The reason for this is the following: The use of the LSDA+ method leads to a strong downward energy shift of the occupied part of the bands and also to a moderate overall downshift of the states as a whole. As a result of the latter, the higher-lying, mostly unoccupied bands in LaMnO3 move somewhat closer to the O 2 bands, which are located in the energy range between 0 eV and 6 eV and are not shifted within the LSDA+ method. Furthermore, the strong downward shift of the occupied bands results in an energetic overlap and therefore strong hybridization between the occupied states and the O 2 bands. In this case the simple two-band TB model is not applicable any more, and some mixed - bands, which extend above the original top of the O 2 states at 6 eV, reach above the Fermi level. Since the LSDA+ method corrects only for the Coulomb interactions between the Mn states, it is not obvious whether this shift of the states relative to the O 2 states is a real physical effect or rather an artifact of the LSDA+ method (see Sec. IV for a further discussion of this point). An exact experimental determination of the energy separation between the Mn and O states in LaMnO3 would provide further insight on this.
III.4 GdFeO3-type rotations
Finally, we address the effect of the GdFeO3-type oxygen octahedra rotations. These distortions change the Mn-O-Mn bond angles and are therefore expected to alter the magnitude of the hopping amplitudes. In addition, due to the resulting symmetry lowering, this distortion will enable hopping between orbitals that was either symmetry-forbidden or negligibly small in the undistorted state.
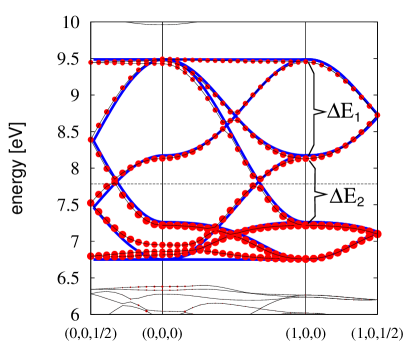
Fig. 11 shows the calculated LSDA energy bands for the structure where only the GdFeO3-type distortion, component (ii) in Sec. II.3, is included, whereas the JT distortion, component (i), is set to zero. The Wyckoff positions of the oxygen anions for this configuration are listed in Table 1 (line “GFO”). In this structure the Mn-O-Mn bond angles are reduced from the ideal 180∘ to about 155∘. The thick line in Fig. 11 corresponds to a fit within the next-nearest neighbor TB model with both nearest and next-nearest hopping amplitudes scaled by a factor of 0.7 compared to the perfectly cubic case. The high quality of the fit is striking, even though the LSDA band structure shows some additional dispersion at the bottom of the bands which is not accounted for in the TB model. It appears that, to a good accuracy, the oxygen tilts can be incorporated in the model simply by reducing the hopping amplitudes in an appropriate way without having to include additional hopping parameters due to the lower symmetry.
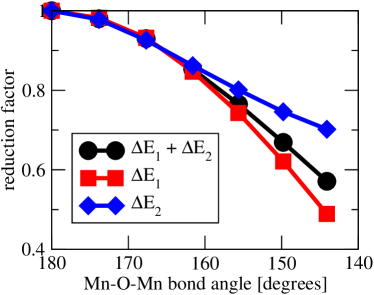
To further quantify the reduction of the hopping amplitudes as a result of the GdFeO3-type distortion, we perform calculations for different degrees of distortion, by scaling (see Table 1) accordingly. Fig. 12 shows the resulting reduction of some characteristic energy differences at the -point as a function of the Mn-O-Mn bond angle. If the GdFeO3-type rotations would lead to a simple scaling of the undistorted band-structure, all the lines in Fig. 12 would fall on top of each other. It can be seen that this is in fact a good approximation for Mn-O-Mn bond angles down to 155∘, which corresponds to the experimentally observed structure of LaMnO3. For bond angles smaller than 155∘ the band-structure starts deviating more significantly from the cubic case due to new hopping paths that become allowed in the distorted structure.
IV Summary and conclusions
In summary, we have shown, by comparing LSDA band-structure calculations to simple TB models, that the relevant electronic states in LaMnO3 are well described by a model of orbitals with nearest and next-nearest neighbor hoppings. We have quantified the effect of changes in bond length (Fig. 7) and of the octahedral rotations (Fig. 12) on the hopping parameters, and we find that for physically relevant values (bond angles ) the GdFeO3-type rotations significantly change the value of the hopping parameters but do not invalidate the TB description. Of particular importance is our finding that both the JT lattice distortions and the Hund’s rule coupling are quantitatively accounted for by adding on-site interactions to the TB model, without changing the hopping parameters. In summary, these results justify a TB plus interaction description of manganite systems, and suggests more generally that such a description is useful for transition metal oxides.
The parameters for nearest and next nearest neighbor hopping (defined in Eqs. (3) and (8)-(13)) which we obtain for the ideal cubic structure with lattice constant Å are eV and eV. The Hund’s rule and JT coupling constants (defined in Eqs. (4)-(5)) which we obtain from our analysis are eV and eV/Å. Our value of eV for the Hund’s coupling is in excellent agreement with the exchange splitting eV derived from x-ray absorption measurements,Dessau and Shen (2000) and agrees well with previous LSDA calculations.Ahn and Millis (2000); Yamasaki et al. (2006a) On the other hand, the strength of the JT coupling obtained in this work is smaller than what has been concluded from x-ray absorption measurements in Ref. Dessau and Shen, 2000 It is also smaller compared to various other values obtained previously from (mostly less elaborate) fits of similar TB models to LSDA or LSDA+ band-structure calculations.Ahn and Millis (2000); Popovic and Satpathy (2000); Yin et al. (2006); foo (b)
Popovic and Satpathy used a fitting procedure very similar to the one presented here, and obtained a JT coupling strength of eV/Å (in our notation), compared to eV/Å obtained in the present work.Popovic and Satpathy (2000) We ascribe this difference to the use of the atomic sphere approximation (ASA) in the LSDA calculation of Ref. Popovic and Satpathy, 2000. In the ASA the crystal volume is represented by an arrangement of overlapping “atomic spheres”.Andersen (1973) This overlap introduces an error, which furthermore depends on the amplitude of the JT distortion (since the JT distortion changes the overlap between the atomic spheres) and thus can have a pronounced effect on .
Ahn and Millis used a TB model very similar to the one used in this work, except that they didn’t include the effect of next-nearest neighbor hopping.Ahn and Millis (2000) They obtained a value of eV/Å by simultaneously fitting 15 energies at 4 different high symmetry -points to a previous LSDA calculation for the fully distorted antiferromagnetically ordered case. It is not obvious how sensitive such a simultaneous root mean square fit of all the model parameters is to the exact value of , but we expect that the neglect of next nearest neighbor hopping will lead to a renormalization of the other parameters of the TB model in order to account for the missing dispersion due to the next-nearest neighbor hopping.
A value of eV/Å was obtained by Yin et al.Yin et al. (2006) by calculating the dependence of several quantities on the amplitude of the JT distortion. This dependence was first obtained from LSDA+ calculations within a Wannier function representation, and then compared to the corresponding results calculated for a model Hamiltonian including electron-electron interactions within the Hartree-Fock approximation. As in the case of Ref. Ahn and Millis, 2000 discussed above, it is not clear how sensitive this simultaneous fit of all parameters in the model Hamiltonian is to moderate changes in .
In contrast, the fitting procedure described in this work isolates the effect of each term in the Hamiltonian (Eq. (2)) and thus allows to obtain each parameter independently from all others. In particular, it becomes clear from our calculated band-structure shown in Fig. 8, that the JT distortion does not lead to a rigid splitting of the bands, but that instead it has only subtle, albeit rather important effects on band crossings at certain -points in the Brillouin zone. The reason for this is that the JT Hamiltonian in Eq. (5) for and staggered order does not commute with the kinetic energy term in Eq. (3), and that due to the relatively small value eV the hopping energies are dominant, so that in general the effect of the JT distortion is only visible as second order shifts in the energy. In other words, at a generic -point the states picked out by the hopping term are not the eigenstates of the JT distortion. This suggests that the straightforward interpretation of peak splittings in the x-ray absorption spectra of Ref. Dessau and Shen, 2000 as a direct consequence of the JT distortion is not necessarily justified.
Finally, our analysis enables us to clearly identify the limitations of the effective two band TB description of manganite systems. Our TB analysis was successful because in LaMnO3 within LSDA the bands are well-separated from the oxygen 2 bands, and neither the JT distortion nor the magnetic order change this energy spacing, and thus the value of the effective hopping, significantly. The dependence of the effective hopping parameters on the energetic distance between the Mn and the O 2 states (see Eq. (1)) is visible as a 15-20 % difference between the majority-spin and the minority-spin bandwidths and dispersion in the ferromagnetic LSDA calculation for the cubic structure (see Sec. III.2), and also in the high-lying bands of the antiferromagnetic LSDA band-structure shown in Fig. 6. However, in cases where the and O 2 bands overlap in energy, such as for example in our LSDA+ calculation for the purely JT distorted structure shown in Fig. 10, the effective TB analysis fails, and the O 2 levels have to be taken into account explicitly.
The energy shift of the occupied states relative to the oxygen states within the LSDA+ method is mainly caused by the so-called “double-counting correction”, which attempts to correct for those contributions of the electron-electron interaction that are accounted for in both the LSDA and the local Hartree-Fock (“+”) treatment. Since the double-counting correction is notoriously ill-defined, this raises the question of whether such level shifts due to the electron-electron interaction and the resulting substantial renormalization of the effective hopping parameters are real effects, or whether this is an artifact of the LSDA+ scheme, which only accounts for the static (mean-field) electron-electron interaction between the transition metal states, while leaving the O 2 states unchanged (we point out that the same problem is also present within an LDA+DMFT treatment of electronic correlations). Optical evidence (see Ref. Quijada et al., 1998) suggests that the O 2 bands in manganites are located about 4 eV below the Fermi level, consistent with the LSDA result, but more detailed investigations of the energy separation between the Mn and O 2 bands will be useful for future studies.
Acknowledgements.
This work was supported by the MRSEC Program of the National Science Foundation under award number DMR-0213574 (C.E.) and by the Department of Energy under grant number ER-46169 (A.J.M. and C.L.).References
- Jonker and Van Santen (1950) G. H. Jonker and J. H. Van Santen, Physica 16, 337 (1950).
- Wollan and Koehler (1955) E. O. Wollan and W. C. Koehler, Phys. Rev. 100, 545 (1955).
- Coey et al. (1999) J. M. D. Coey, M. Viret, and S. von Molnár, Adv. Phys. 48, 167 (1999).
- Tokura (2000) Y. Tokura, ed., Colossal Magnetoresistive Oxides (Gordon and Breach, 2000).
- Dagotto et al. (2001) E. Dagotto, T. Hotta, and A. Moreo, Phys. Rep. 344, 1 (2001).
- Jin et al. (1994) S. Jin, T. H. Tiefel, M. McCormack, R. A. Fastnacht, R. Ramesh, and L. H. Chen, Science 264, 413 (1994).
- Norby et al. (1995) P. Norby, I. G. K. Andersen, E. K. Andersen, and N. H. Andersen, J. Solid State Chemistry 119, 191 (1995).
- Elemans et al. (1971) J. B. A. A. Elemans, B. Van Laar, K. R. Van der Veen, and B. O. Loopstra, J. Solid State Chemistry 3, 238 (1971).
- Kanamori (1960) J. Kanamori, J. Appl. Phys. (Suppl.) 31, 14S (1960).
- Woodward (1997) P. M. Woodward, Acta Cryst. B 53, 32 (1997).
- Hohenberg and Kohn (1964) P. Hohenberg and W. Kohn, Phys. Rev. 136, B864 (1964).
- Kohn and Sham (1965) W. Kohn and L. J. Sham, Phys. Rev. 140, A1133 (1965).
- Gunnarsson et al. (1989) O. Gunnarsson, O. K. Andersen, O. Jepsen, and J. Zaanen, Phys. Rev. B 39, 1708 (1989).
- Hybertsen et al. (1989) M. S. Hybertsen, M. Schlüter, and N. E. Christensen, Phys. Rev. B 39, 9028 (1989).
- Pickett and Singh (1996) W. E. Pickett and D. J. Singh, Phys. Rev. B 53, 1146 (1996).
- Satpathy et al. (1996) S. Satpathy, Z. S. Popovic, and F. R. Vukajlović, Phys. Rev. Lett. 76, 960 (1996).
- Solovyev et al. (1996) I. Solovyev, N. Hamada, and K. Terakura, Phys. Rev. Lett. 76, 4825 (1996).
- Terakura et al. (2000) K. Terakura, I. V. Solovyev, and H. Sawada, in Colossal Magnetoresistive Oxides, edited by Y. Tokura (Gordon and Breach, 2000), pp. 119–148.
- Ahn and Millis (2000) K. H. Ahn and A. J. Millis, Phys. Rev. B 61, 13545 (2000).
- Popovic and Satpathy (2000) Z. Popovic and S. Satpathy, Phys. Rev. Lett. 84, 1603 (2000).
- Yin et al. (2006) W.-G. Yin, D. Volja, and W. Ku, Phys. Rev. Lett. 96, 116405 (2006).
- Blöchl (1994) P. E. Blöchl, Phys. Rev. B 50, 17953 (1994).
- Kresse and Furthmüller (1996) G. Kresse and J. Furthmüller, Phys. Rev. B 54, 11169 (1996).
- Kresse and Joubert (1999) G. Kresse and D. Joubert, Phys. Rev. B 59, 1758 (1999).
- foo (a) We use the notation of Ref. Bradley and Cracknell, 1972 to denote the high-symmetry points within cubic, tetragonal, and orthorhombic Brillouin zones.
- Bradley and Cracknell (1972) C. J. Bradley and A. P. Cracknell, The mathematical theory of symmetry in solids (Oxford University Press, 1972).
- Yamasaki et al. (2006a) Y. Yamasaki, S. Miyasaka, Y. Kaneko, J.-P. He, T. Arima, and Y. Tokura, Phys. Rev. Lett. 96, 207204 (2006a).
- Yamasaki et al. (2006b) A. Yamasaki, M. Feldbacher, Y.-F. Yang, O. K. Andersen, and K. Held, Phys. Rev. Lett. 96, 166401 (2006b).
- Anisimov et al. (1997) V. I. Anisimov, F. Aryasetiawan, and A. I. Liechtenstein, J. Phys.: Condens. Matter 9, 767 (1997).
- Dudarev et al. (1998) S. L. Dudarev, G. A. Botton, S. Y. Savrasov, C. J. Humphreys, and A. P. Sutton, Phys. Rev. B 57, 1505 (1998).
- Dessau and Shen (2000) D. S. Dessau and Z.-X. Shen, in Colossal Magnetoresistive Oxides, edited by Y. Tokura (Gordon and Breach, 2000), pp. 149–185.
- foo (b) Note that different conventions for the JT coupling are used throughout the literature, so that care must be taken when comparing values from different sources.
- Andersen (1973) O. K. Andersen, Solid State Commun. 13, 133 (1973).
- Quijada et al. (1998) M. Quijada, J. Černe, J. R. Simpson, H. D. Drew, K. H. Ahn, A. J. Millis, R. Shreekala, R. Ramesh, M. Rajeswari, and T. Venkatesan, Phys. Rev. B 58, 16093 (1998).