IR-active optical phonons in Pnma-1, Pnma-2 and Rc phases of LaMnO3+δ
Abstract
Infrared-active phonons in LaMnO3+δ were studied by means of the reflection and transmission spectroscopy from 50 to 800 cm-1 at room temperature. Powder and ceramic samples of the phases of Pnma-2 (), Pnma-1 (), and Rc () were investigated. Besides, energies of the dipole-active phonons in Pnma-2, Pnma-1 phases were obtained by lattice-dynamics calculations. The transformations of IR-active phonons with the increase of in the sequence of Pnma-2, Pnma-1, Rc are discussed.
pacs:
61.50.Ah, 78.30.-jI Introduction
Electrical and magnetic properties of perovskitelike compounds RxAyMO3+δ (R = rare earth; A = Ca, Sr, Ba, Pb; M = Cu, Mn, Ti, V) can drastically change with varying . In last decades such materials have been intensively investigated. In 1986 superconductivity with =30 K was found in La2-xBaxCuO4+δ.[Bednorz and Muller, 1986] Using of some other transition metals M can result in the compounds (La1-xAxMnO3+δ, for example) with “colossal” magnetoresistance.von Hemlolt et al. (1993); Chahara et al. (1993); Jin et al. (1994) Cuprates and manganites possess many common features: the crystal structure (close to the perovskite) and strong electron–electron, electron–phonon, and exchange interaction. With they are antiferromagnetic dielectrics at low temperatures. An increase of results in a dielectric-metal transition.Loktev and Pogorelov (2000)
Some excess oxygen in La2CuO4+δ brings about the same transformation of the electronic spectrum that results from the partial substitution of La by an alkali earth, the transformation going up to the superconducting phase.Zakharov et al. (1998) Similarities between cuprates and manganites stimulated studies of the influence of excess oxygen on the electron and phonon spectra of LaMnO3+δ.
It’s well known that the crystal structure of both LaMnO3+δ and La1-xAxMnO3 is orthorhombic at , and K. An increase of and results in a rhombohedral phase Rc. Töpfer and Goodenough (1997); Kavano et al. (1996); Urushibara et al. (1995) In any case the crystal is insulating and paramagnetic above 200–300 K. With decreasing temperature the Rc phase transforms into an orthorhombic phase, insulating and ferromagnetic at , metallic and ferromagnetic at .Töpfer and Goodenough (1997) Two orthorhombic phases of LaMnO3+δ have been found.Mitchell et al. (1996); Hauback et al. (1996); Huang et al. (1997); Töpfer and Goodenough (1997) They were denoted as either Pnma-1, Pnma-2 (Ref. Huang et al., 1997) or , (Ref. Töpfer and Goodenough, 1997). The first one, Pnma-2 (), is an insulating antiferromagnet at low temperatures and exists at small ; the second one, Pnma-2 (), is an insulating ferromagnet at low temperatures and exists at larger .
Orthorhombic phases can belong to different space groups (the orthorhombic phase of the La2CuO4, for example, belongs to the Cmca space group). To emphasize that both and phases of LaMnO3+δ belong to the same space group Pnma we, following Ref. Huang et al., 1997, use the notation Pnma-2, Pnma-1. Unfortunately, this notation does not show the local symmetries of the atoms or the Wyckoff positions, which are subgroups of the point group . It’s the local symmetry that determines the number of modes in every irreducible representation.
The purpose of the present study was to examine the spectra of dipole-active optical phonons in Pnma-2, Pnma-1 and Rc phases. Especially, we paid attention to transformations that phonon states undergo upon transitions from the phase Pnma-2 to Pnma-1 and then to Rc, which are induced by a high-temperature treatment. Optical phonons in the Pnma-2 and Rc phases were measured in Refs. Iliev et al., 1998, 2003 (Pnma-2, Raman); Paolone et al., 2000; Jung et al., 1998 (Pnma-2, IR); Abrashev et al., 1999; Iliev et al., 2003, 2000 (Rc, Raman); and Abrashev et al., 1999; Kebin et al., 1997 (Rc, IR). In the present study, we focus on the IR spectrum of the Pnma-1 phase of LaMnO3+δ. To our knowledge, there are no data on either IR or Raman spectra of this phase at the moment.
The Pnma-2, Pnma-1 phases are isostructural, so the number of phonon modes should be the same in both cases. However, the number of IR-active modes observed experimentally in the spectra of the Pnma-1 phase is smaller than that for the Pnma-2 phase. In the Rc phase an experiment shows more modes than group theory predicts for the Rc symmetry.
II Crystal structure of LaMnO3+δ phases
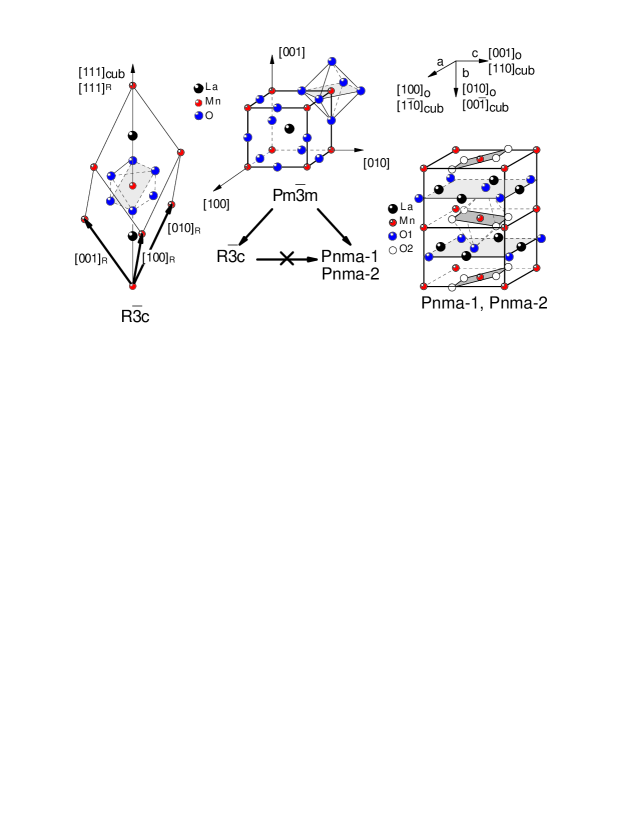
Since phonon modes are closely related to the crystal lattice symmetry, let us summarize some well known data about crystal structure of four LaMnO3+δ phases. The structure of the parent cubic phase Pmm is shown in the centre of Fig. 1. At ambient pressure, this phase exists at temperatures above 870 K. At room temperature there exist three phases: orthorhombic Pnma-2, Pnma-1 and trigonal (rhombohedral) Rc.Elemans et al. (1971); Huang et al. (1997); Mitchell et al. (1996); Hauback et al. (1996)
X-ray analisys shows the following:
-
•
In the Pnma-2 phase the positions of O2 oxygens (see Fig. 1) deviate considerably from those in the cubic phase. The oxygen octahedra are strongly distorted, particularly in Mn–O2 plane, the Mn–O2 distances differ from each other (1.90 and 2.17 Å).
-
•
In the Pnma-1 phase the positions of O2 oxygens slightly deviate from that in the cubic phase, the oxygen octahedra are slightly distorted, the Mn–O2 distances being close to each other.
-
•
In comparison with the cubic phase, in both orthorhombic phases the oxygen octahedra are rotated around [010] (cubic) axis by nearly the same angle (the difference is 1–3∘).
To distinguish between the Pnma-1 and Pnma-2 phases experimentally, it is sufficient to determine the dimensions of the unit cell: . In the Pnma-2 phase and Å, in the Pnma-1 phase and is 0.04–0.08 Å.
In all considered phases, Mn atoms occupy symmetry-equivalent positions and their time-average charges must be the same. Mn+4 should be defects chaotically distributed in the sample volume. Symmetry forbids any long-range charge ordering in these phases. Such ordering may occur only if the symmetry is lowered.
In contrast to the cubic phase and the trigonal phase, the orthorhombic phases contain two types of inequivalent oxygen atoms. Therefore, these oxygen atoms can have different charges and different amplitudes of displacements in the normal vibration modes. All the six oxygen atoms in the unit cell of the Rc phase are symmetry-equivalent, therefore their scalar parameters, in particular their charges, should be equal.
Arrows in the centre of Fig. 1 show that the point group of the Rc phase and the point group of the Pnma phases are subgroups of the Oh point group of the Pmm phase and corresponding phase transitions of the second kind are allowed. The crossed arrow in Fig. 1 shows that is not a subgroup of . As a result, phase transitions of the second kind from the Rc phase to the Pnma-1, Pnma-2 phases are forbidden. Such phase transitions can be possible only through an increase of symmetry, i. e., through the intermediate cubic phase, which exists at high temperatures.
III Experimental
LaMnO3+δ was prepared from La2MnO3, La(CO3)36H2O and Mn2O3. The stoichiometric mixture of source materials was powdered in a ball planetary mill, after that it was calcined at C, and then it was powdered once again. The main synthesis was conducted at C during 10–20 hours. was measured by iodometric titration of the Mn+3, Mn+4 ions.
It is known that the Pnma-2 phase can be transformed to the Pnma-1 phase by annealing in air. Upon further annealing in oxygen, the Pnma-1 phase transforms into the c phase.Töpfer and Goodenough (1997) In Ref. Iliev et al., 1998 the Pnma-2 phase was obtained by heating of the Rc phase in N2 atmosphere at C. We realized the reversible sequence of transformations: Rc Pnma-1 Pnma-2. First, we kept LaMnO3+δ powder at C during 10 hours, then different speeds of cooling resulted in different phases. For the measurements of the IR reflection spectra, ceramic pellets of the Pnma-1, Rc phases were prepared from the powder by pressing it and subsequent annealing at C during 10 hours. We could not obtain ceramic pellets of the Pnma-2 phase.
Magnetic permeability of the Pnma-2, Pnma-1, Rc phases was measured in the 77–300 K temperature range in the AC 2500 Hz magnetic field of 1 Oe at slow heating. The measurements were performed on powder manually pressed into a quartz tube of 2 mm in diameter. This technique results in some uncertainty in the amount of material under investigation. Therefore, the absolute value of the permeability was obtained with some uncertainty, yet we determined the main features of its temperature dependence.
IR reflection spectra of ceramic pellets and the IR transmission spectra of powder samples were obtained using a Fourier-transform spectrometer in the spectral range 50–800 cm-1 at room temperature. The reflection spectra were measured in the arrangement where the light falls on a pellet surface near perpendicularly, and an aluminum mirror was used to obtain a reference spectrum. In order to measure transmission spectra, either a polyethylene or a KBr plate (depending on the spectral range) was covered by powder sample, and the transmission spectrum of the plate was used as a reference. Transmission then was converted to absorbance .
IV Results and discussion
According to X-ray analysis, the unit cell parameters of the Pnma-2, Pnma-1, Rc phases we synthesized were the following:
phase
, Å
, Å
, Å
Pnma-1
5.505
7.776
5.513
Pnma-2
5.732
7.693
5.536
For Rc Å, Å in the hexagonal coordinates.
These parameters are concordant, for instance, with the results of Huang et al.Huang et al. (1997)
Titration has shown the following percentage of Mn+4 ions in investigated samples: Pnma-2, 5%; Pnma-1, 15%; Rc 30%. It corresponds to equal to 0.025, 0.075 and 0.15 for the Pnma-2, Pnma-1 and Rc phases, respectively.
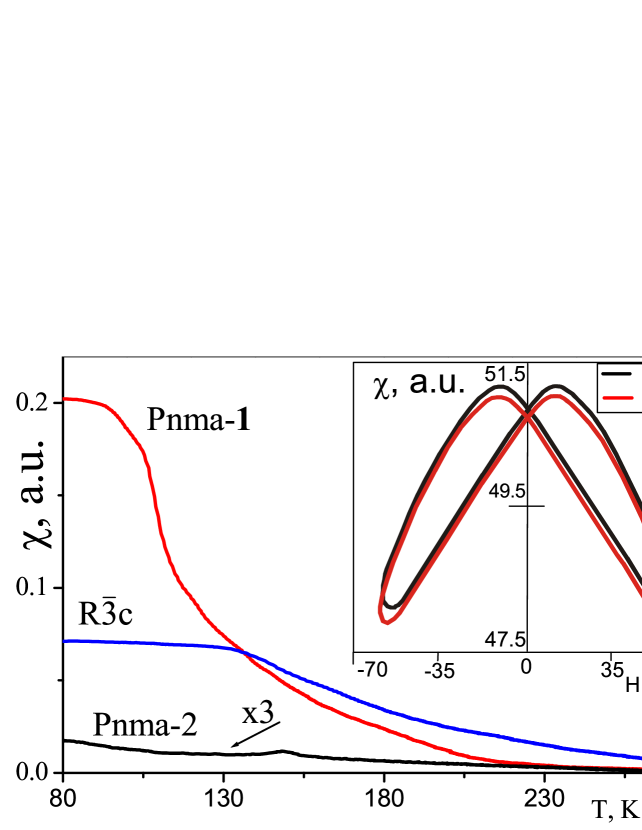
The magnetic permeabilities of Pnma-2, Pnma-1 and Rc are shown in Fig. 2. All phases are paramagnetic near the room temperature. At low temperature Pnma-1 and Rc are ferromagnetic, and Pnma-2 is antiferromagnetic. Ferromagnetic behaviour is illustrated by hysteretic dependence of the permeability upon the magnetic field, which appears below the transition temperature and becomes more and more pronounced with decreasing temperature, see the inset in Fig. 2. The temperature of the antiferromagnetic transition in Pnma-2 is 140 K, in agreement with Refs. Huang et al., 1997; Töpfer and Goodenough, 1997. To obtain the temperatures of the ferromagnetic transitions in Pnma-1 and Rc, we plotted inverse permeability versus temperature, and linearly extrapolated to zero value the high-temperature parts of these dependences. In agreement with Ref. Töpfer and Goodenough, 1997, the transition temperatures turned out to be 180 and 240 K in the Pnma-1 and Rc phases, respectively. These results confirm that we really deal with the Pnma-2, Pnma-1 and Rc phases.
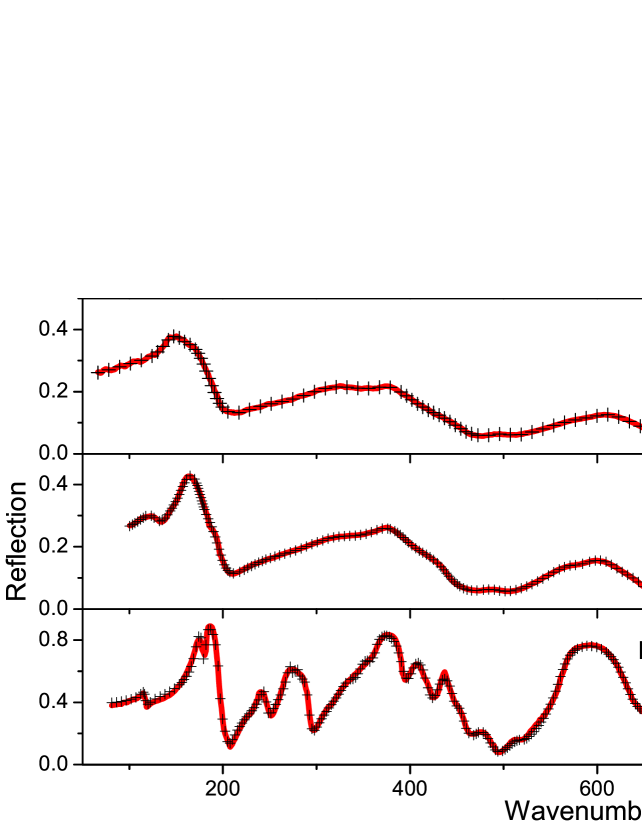
In Fig. 3 the reflection spectra of the phases Rc (), Pnma-1 (), and Pnma-2 () are shown. In the present wavenumber range reflection spectra are determined by dipole-active phonons. We approximated our reflectivity spectra using a fitting procedure based on a set of Lorentz oscillators:
| (1) |
is the complex dielectric function; and are oscillator strength, frequency and damping factor of mode . The number of oscillators we used in every case was chosen as the minimum number allowing a good fit. The crosses on Fig. 3 show the result of the fitting.

Fig. 4 shows the conductivity contributions of the calculated Lorentz oscillators:
| (2) |
Paolone et al.Paolone et al. (2000) compared experimental and theoretically calculatedSmirnova (1999) phonon frequencies of Pnma-2 phase. Taking into account the lowest and the highest phonon frequencies obtained by Paolone et al.Paolone et al. (2000), we corrected previously calculatedSmirnova (1999) phonon frequencies of the Pnma-2 phase. Also, we calculated the phonon frequencies of the Pnma-1 phase using the rigid-ion model with effective charges. Table 1 shows the results of these calculations along with the phonon frequencies extracted from experimental data. We measured spectra of ceramic samples. So the polarization symmetry of the IR-active phonons could not be obtained from our experiments and the arrangement of the modes is tentatively done according to their frequencies and intensities.
| Pnma-2 | Pnma-1 | Rc | |||||
|---|---|---|---|---|---|---|---|
| calc. | exp. | calc. | exp. | exp. | |||
| () | () | () | () | () | |||
| 115(119) | 116(120) | 4 | 111(115) | ||||
| 116(118) | 120(130) | 125(135) | 20 | 120(140) | 62 | ||
| 138(140) | 143(148) | 147(180) | 29 | ||||
| 171(197) | 172(244) | 6 | 166(196) | 163(209) | 24 | 167(197) | 38 |
| 175(195) | 182(195) | 3 | 181(199) | 187(195) | 27 | ||
| 231(232) | 201(203) | 9 | 229(230) w | ||||
| 233(249) | 244(255) | 7 | 247(248) w | ||||
| 249(250) | 300(302) w | ||||||
| 254(281) | 271(291) | 5 | 253(253) w | ||||
| 284(296) | 277(297) | 9 | 270(291) | 258(267) | 74 | 252(266) | 88 |
| 297(305) | 285(293) | 9 | 280(281) w | ||||
| 309(309) | 332(354) | 327(381) | 95 | 324(376) | 97 | ||
| 330(341) | 335(363) | 15 | 355(371) | ||||
| 346(352) | 350(411) | 16 | 368(370) w | ||||
| 354(373) | 362(391) | 10 | 377(440) | 372(401) | 60 | 376(400) | 68 |
| 420(426) | 400(401) | 16 | 382(448) | ||||
| 434(450) | 429(437) | 18 | 416(417) w | 420(429) | 59 | 431(442) | 78 |
| 455(457) | 451(452) | 12 | 437(444) | ||||
| 473(479) | 474(480) | 28 | 487(503) | 487(490) | 40 | 498(592) | 33 |
| 528(531) | 515(518) | 18 | 564(568) | ||||
| 573(598) | 561(606) | 17 | 580(589) | 567(579) | 49 | 576(592) | 85 |
| 634(640) | 644(646) | 39 | 584(641) | 599(618) | 57 | 611(627) | 65 |
| 644(650) | 615(616) w | ||||||
| 645(651) | 634(639) | 637(642) | 51 | 649(653) | 57 | ||
In Table 1, “” and “” indices correspond to the “transverse” and “longitudinal” frequencies. A frequency means a resonant frequency (see Equation (1)) and coincides with a maximum of (see Equation (2)). frequencies in Table 1 correspond to maxima of the function and represent oscillator strengths .
IV.1 IR spectra of the Pnma phases
According to group theory, the isostructural Pnma-1 and Pnma-2 phases should have 25 dipole-active optical phonon modes, 9B1u+7B2u+9B3u (see, for example, Ref. Smirnova, 1999). Indeed, Paolone et al.Paolone et al. (2000) experimentally found 25 IR-active modes in Pnma-2 crystals at 10 K (and 18 modes at room temperature). However, in our Pnma-1 ceramic only 11 modes can be distinguished at room temperature.
The lines in the Pnma-1 ceramic are substantially wider than in the Pnma-2 single crystals (see damping factors in Table 1). Let’s consider possible reasons for this broadening.
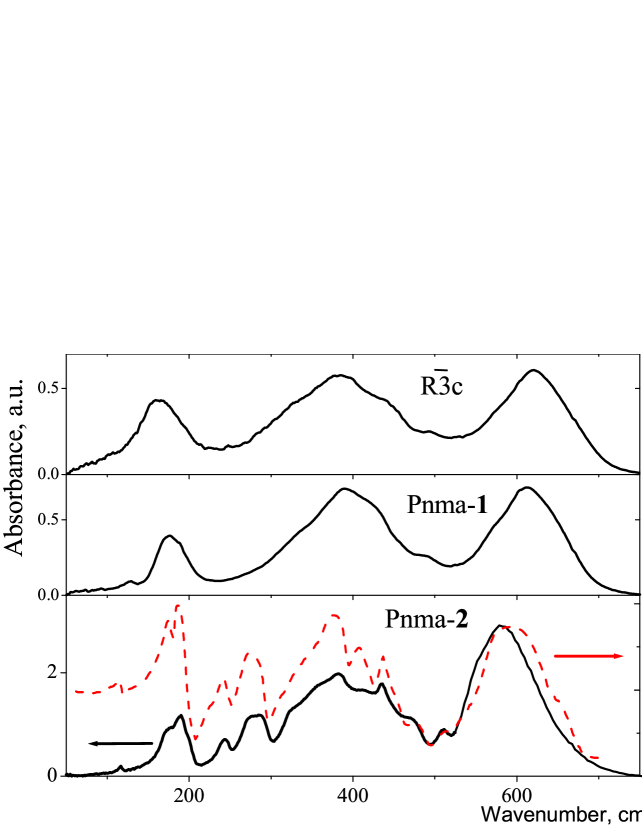
Decreasing of the phonon life time accompanied by increasing of could come as a result of the phonon scattering on grain boundaries of ceramic. To check that, we measured transmission spectra of the Pnma-1, Pnma-2 and Rc powders. The grain sizes of our powders were measuredKoneva et al. (2005) using electron microscopy: in all samples the typical grain size is found to be about 1 m. In the transmission spectra, the widths of the phonon lines increase monotonically with the increase of the excess oxygen content, i. e., in the sequence Pnma-2, Pnma-1, Rc. That means that phonon scattering on grain boundaries is not the main reason of line broadening in the spectra of the Pnma-1, Rc powders. The same is even truer for the spectra of the Pnma-1, Rc ceramics, because in a ceramic the typical grains can be larger than that in a source powder. Moreover, we believe that even in our Pnma-2 powder phonon scattering on grain boundaries is not the main reason of the line broadening. In the bottom part of Fig. 5, the dashed line shows the reflection spectrum of a Pnma-2 single crystalPaolone et al. (2000), solid line represents our absorption spectrum of the Pnma-2 powder. Our calculations showed that, on average, the lines in the conductivity spectrum of powder are three times wider than those in the spectrum of a crystal. Nevertheless, one can reveal the same number of lines in both spectra. For example, 172 cm-1 and 182 cm-1 lines can be undoubtedly distinguished in our powder spectrum. It was shownPaolone et al. (2000) that in a doped LaMnO3 single crystal, containing 8% of Mn+4, these lines could not be resolved at room temperature. Our powder contained 5% of Mn+4 so it seems reasonable to attribute the observed broadening of lines in our Pnma-2 powder as a result of oxygen doping.
The main factor of line broadening in the spectra of these samples should be the phonon scattering on structural defects, which multiply with excess oxygen doping. These defects could be oxygen atoms in interstitial sites, like those in La2CuO4+δ [Chaillout et al., 1990]. However as for LaMnO3+δ and La1-xAxMnO3+δ (A=Ca, Sr, Ba), at the moment it is rather believed that the nonstoichiometric oxygen Oδ is compensated by both La and Mn vacancies in equal amounts.van Roosmalen and Cordfunke (1994); Töpfer and Goodenough (1997) In such a case, vacancy contents of La or Mn in our samples would be 0.7%, 2.6% and 5% for the Pnma-2, Pnma-1 and Rc phases respectively.
Line broadening can make difficult or impossible experimental detection of some lines with small oscillator strength. In the Pnma-2 phase, that could be the phonons with the frequencies 400 cm-1, 451 cm-1 (see Table 1). We calculated the oscillator strength for all IR-active modes of the Pnma-2 and Pnma-1 phases. It turns out that the number of modes experimentally detected in the Pnma-1 phase is reduced in comparison with the Pnma-2 phase mainly because the oscillator strength of some phonons of the Pnma-1 phase becomes very small. These Pnma-1 modes are marked by w in Table 1. In the Pnma-1 phase, the lengths of Mn–O bonds differ from each other very little (the difference comes in fourth significant digit). The closeness of Mn–O bond lengths means that oxygen atoms are almost symmetrically equivalent, i. e., the Pnma-1 crystal structure deviates from the cubic one less than the Pnma-2 crystal structure where the difference in Mn–O bond lengths is 15%. In the cubic structure, the number of IR-active phonons is less than in an orthorhombic structure. Therefore, if a structure is close to cubic then some IR-active phonons are “on the verge of disappearance”.
IV.2 IR spectra of Rc
Our spectra of Rc are in satisfactory agreement with the spectra obtained in Ref. Abrashev et al., 1999; Kebin et al., 1997.
According to our experimental results, phonon damping factors of the Rc phase exceed those of the Pnma-1 phase by a factor of 1.3 on average. The first reason is that the Mn+4 content in Rc is two times as large as it is in the Pnma-1 phase, so there are more structural defects there. The second reason is disorder caused by the noncoherent dynamic Jahn-Teller effect.
According to the group-theory analysis (see Ref. Smirnova, 1999, for example), there are 8 IR-active phonon modes in the Rc phase: 3A2u+5Eu. At room temperature, in reflection spectra of the Rc ceramic we definitely distinguish 10 lines. The approximation by a set of Lorentz oscillators revealed an additional very broad line near 120 cm-1. Therefore, we found in the Rc phase the same amount of lines (11) as in the Pnma-1 phase.
Let us consider possible reasons for appearing of additional lines in spectra of the Rc phase.
Local break of the inversion symmetry around a point defect could make some Raman-active (IR-forbidden) modes to appear in IR spectra. However, comparison of the IR spectra of the Rc phase with Raman spectra of Abrashev et al.Abrashev et al. (1999) shows that there is only one Raman line near 649 cm-1 close to an IR line (640 cm-1), the other Raman lines have no counterparts in our IR spectra.
In IR spectra there could appear maxima of the phonon density of states caused by breaking of the long-range order. Iliev et al.Iliev et al. (2003) analyzed the Raman spectra of doped rare-earth manganites and interpreted them in the frame of the model used for description of amorphous materials.Shuker and Gammon (1970) The Raman spectra in this case are dominated by disorder-induced bands, reflecting the phonon density of states smeared due to finite phonon lifetime. In other words, the law of conservation of the quasimomentum breaks and phonons with nonzero begin to interact with light. In general, the same mechanism could definitely work for IR spectra too. Big linewidths prevent us from supporting or rejecting an influence of phonons with on IR spectra of the Rc phase. Though it worth to take into account that according to Iliev et al.Iliev et al. (2003) a Raman mode generally gives several maxima of density of states. Probably the same is true for IR-active modes. However, our spectra of the Rc phase can be fitted very well by a few Lorentz functions. So we think that the phonons with can have only a small influence on our spectra, they do not determine essential spectral features.
We explain additional lines in our IR spectra of the Rc phase as a result of the dynamic Jahn-Teller effect. In the Rc phase of LaMnO3, the Rc symmetry exists only “on average”, revealing itself in certain kinds of experiments such as X-ray diffraction. At any particular moment of time, one of the octahedron O–Mn–O axes differs from two others due to dynamic Jahn-Teller distortions; therefore, oxygen atoms are inequivalent and their charges are not equal. It is the “instant”, not “average”, pattern that is probed in optical experiments.Iliev et al. (2003) Obviously, normal phonon modes, measured by means of IR and Raman spectroscopy, are normal modes of the “instant”, not average” pattern. In the “instant” view every octahedron in the Rc phase looks deformed, mostly in the same way as the octahedra in the Pnma phases. That’s why the phonon spectrum of the Rc phase resembles that of the Pnma phases. Similarly, Abrashev et al.Abrashev et al. (1999) interpreted two strongest lines (649 cm-1 is one of them) in their Raman spectra of the Rc phase as “forbidden” modes, analogous to the respective modes in Pnma phases.
We can expect some correlations between the Jahn-Teller deformations of the octahedra in the Rc phase. Qiu et al.Qiu et al. (2005) found that in high-temperature ( K) stoichiometric rhombohedral LaMnO3 there are fully distorted MnO6 octahedra, ordered in clusters of diameter Å. According Ref. Töpfer and Goodenough, 1997, the phase diagram of LaMnO3+δ containes an area () where a phase transition Rc Pnma-1 exists at K. As we mentioned in Section II, such transition of a second kind is forbidden by symmetry. In Ref. Shekhtman et al., 2004 there was suggested a model of a phase transition through a virtual cubic phase. Taking into account the known IR and Raman spectra of the Rc phase, as well as the results of Qiu et al.Qiu et al. (2005), we suggest that the Rc samples could contain nanoclusters of some Pnma phase. Such inclusions may be growing centres at the transition Rc Pnma-1 of a first kind.
V The influence of selection rules of D2h point group on the IR spectra
According to the selection rules, the irreducible representations B1u, B2u, B3u of D2h point group correspond to IR-active modes, their total electric dipole moment taking the form . Similarly, for every full set of symmetrically equivalent atoms in the unit cell (O2, for example) the sum of their atomic displacements has only one non-zero component. (For a single atom inside such a set, all three components can differ from zero.)
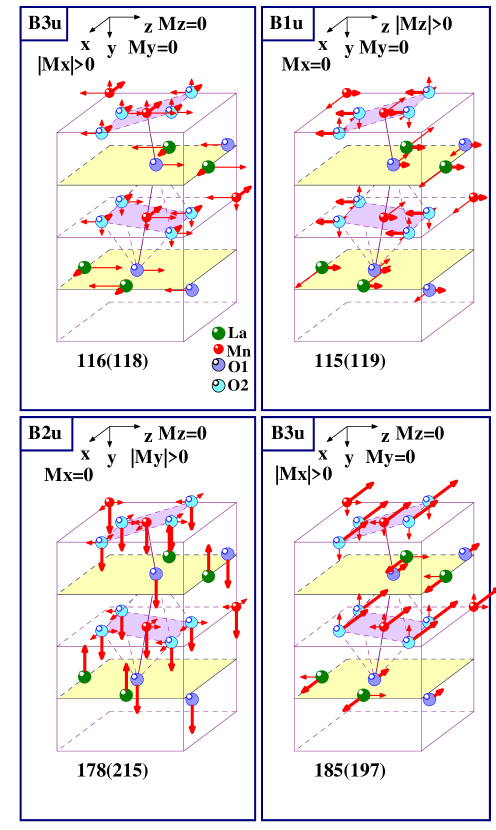
Let’s consider four lowest-frequency IR-active modes of the Pnma-2 phase. (Fig. 6)
The line with the lowest frequency (115 cm-1) can be distinctly seen in the spectra of the Pnma-2 and Pnma-1 phases. In the spectrum of the Rc phase it substantially broadens (Fig. 4). A similar line have been observed in reflection spectra of both the undoped ( ) and doped by either Ca or Sr La1-xAxMnO3+δ, LaTiO3Lunkenheimer et al. (2003), YVO3Tsvetkov et al. (2004). Theoretical calculationsSmirnova (1999) and experimental resultsTsvetkov et al. (2004) show that in the spectra of the Pnma-2 phase this line consists of two modes with close frequencies and different polarizations (see the upper part of Fig. 6).
In B1u, B3u modes, La and O1 atoms can vibrate only in the reflection plane therefore having two degrees of freedom.
115 cm-1 mode (B1u) has the maximal displacements of La atoms along axis. Nevertheless, these components don’t contribute to the total electrical dipole moment because their sum equals zero. Only small components of the La displacements along axis (thick arrows) contribute to . The intensity of this mode in the optical conductivity spectrum is determined by the displacements of O2, Mn, La atoms, their contributions adding together. Relatively small contributions of O1 atomic displacements have the opposite sign.
The structure of atomic displacements of 116 cm-1 mode (B3u) is similar to the previous one. The biggest displacements of La atoms are along axis, being parallel to axis. The intensity of this mode is determined by the adding contributions of O2, La displacements and the subtracting contribution of Mn displacement.
In 178 cm-1 mode (B2u) O1 and La atoms can vibrate only along axis, in 185 cm-1 mode (B3u) they can vibrate only in (0,1,0) plane. An essential difference between these modes and 115 cm-1, 116 cm-1 modes is that in 178 cm-1, 185 cm-1 modes the maximal displacements of every atom contribute to (O1, O2, La are adding, Mn is subtracting). That is why the oscillator strengths of 178 cm-1, 185 cm-1 modes are much higher than that of 115 cm-1, 116 cm-1 modes.
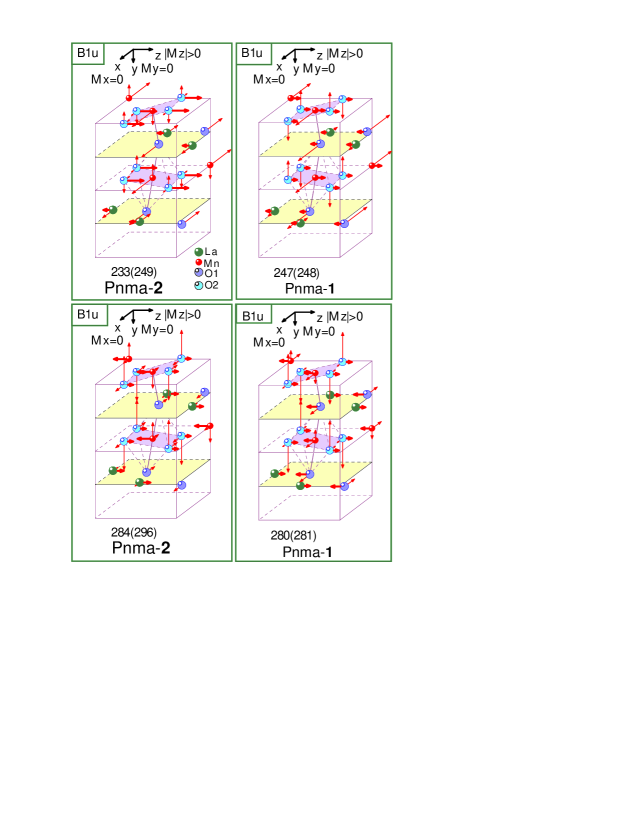
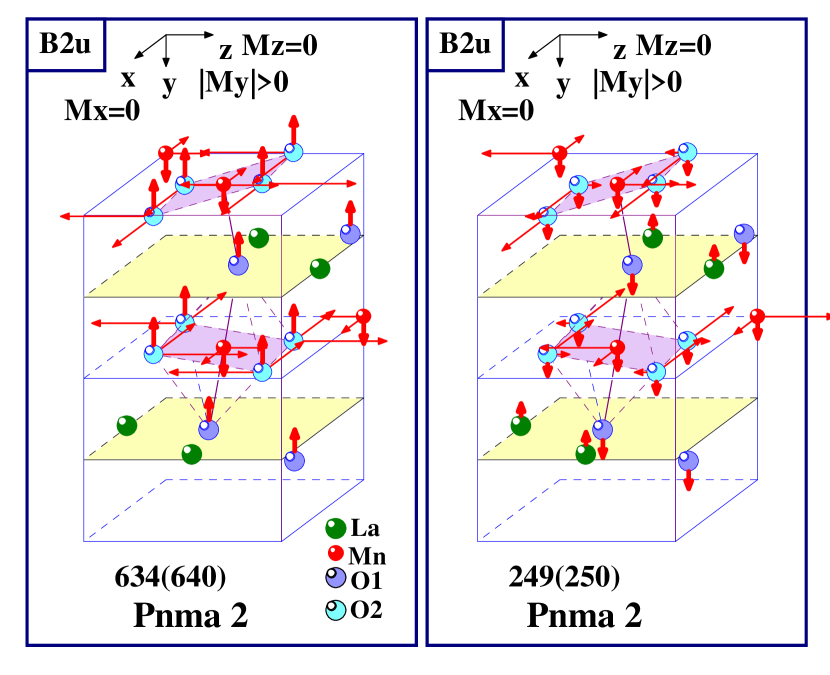
Being isostructural, the Pnma-2 and Pnma-1 phases have close patterns of atomic displacements in phonon modes. Still, there are some important differences between them. In the upper part of Fig. 7 there are shown 233 cm-1 mode of the Pnma-2 phase and 247 cm-1 mode of the Pnma-1 phase. Big displacements of Mn and O1 along axis, which have comparable magnitudes for the Pnma-2 and Pnma-1 phases, don’t contribute to . In the both cases, the oscillator strengths are entirely determined by small displacements along axis, which are much less for the Pnma-1 phase (247 cm-1) than for the Pnma-2 phase (233 cm-1). As a result, the oscillator strength 247 cm-1 mode of the Pnma-1 phase is very small.
In the bottom part of Fig. 7 there are shown another pair of similar modes. The oscillator strength of 284 cm-1 mode (Pnma-2) is much higher than that of 280 cm-1 mode (Pnma-1), because in the second case the displacements of Mn, O2 atoms along axis are substantially less. In addition, the displacements of O1 atoms, which decrease the resulting , are of much higher amplitude in 280 cm-1 mode (Pnma-1) than in 284 cm-1 mode (Pnma-2).
Our theoretical calculations showed that there are six modes in total, which strongly decrease their oscillator strength for the Pnma-1 phase in comparison with that for the Pnma-2 phase. (In Table 1 they are marked by w.) That’s why for the Pnma-1 phase the number of modes seen in experiment is less than for the Pnma-2 phase.
The atomic displacements of all IR-active modes for the Pnma-2 phase are drawn in Fig. 5 of Ref. Smirnova, 1999. Mostly, the displacements of O1, O2 atoms are much bigger than that of Mn, La atoms. As a result, the small components were ignored there. For a strong mode, that was reasonable. However for a weak mode, that could cause some misunderstanding. For example, all the displacements shown in Ref. Smirnova, 1999 for 207 cm-1 and 562 cm-1 modes produce the resulting . More correct patterns for these modes are shown in Fig. 8.
VI Conclusions
The reversible sequence of transformations Rc Pnma-1 Pnma-2 was realized by annealing of LaMnO3+δ powder at C during 5–10 hours.
For the first time, IR transmission and reflection spectra of the Pnma-1 phase of LaMnO3+δ were measured. In addition, IR spectra of the Pnma-2 and Rc phases were measured and found to be in satisfactory agreement with previously published results.
Taking into account new experimental data for the Pnma-2 phase, we corrected our parameters of the rigid-ion model with effective charges and recalculated its phonon spectrum. The frequencies and oscillator strengths of the IR-active phonons in Pnma-1 phase were calculated as well.
The number of experimentally observed IR-active phonon modes in the Pnma-1 phase is smaller than that in the Pnma-2 phase, although these phases have the same Pnma symmetry. According to theoretical calculations, it happens due to a decrease in the oscillator strengths of several phonon modes of the Pnma-1 phase. The underlying reason is that in the Pnma-1 phase MnO6 octahedra are much less distorted than in the Pnma-2 phase.
In the spectra of the Rc phase, the number of modes observed exceeds that predicted by group theory. We attribute the additional modes to local distortions of oxygen octahedra similar to those in Pnma phases.
Acknowledgements.
We thank S. S. Nazin for useful discussion.References
- Bednorz and Muller (1986) J. G. Bednorz and K. A. Muller, Z. Phys. B64, 189 (1986).
- von Hemlolt et al. (1993) R. von Hemlolt, J. Wecker, B. Holzapfel, I. Schultz, and K. Samwer, Phys. Rev. Lett. 71, 2331 (1993).
- Chahara et al. (1993) K. Chahara, T. Ohno, M. Kasai, and Y. Kozono, Appl. Phys. Lett. 63, 1990 (1993).
- Jin et al. (1994) S. Jin, T. H. Tiefel, M. McCormack, R. A. Fastnacht, R. Ramesh, and L. H. Chen, Science 264, 413 (1994).
- Loktev and Pogorelov (2000) V. M. Loktev and Yu. G. Pogorelov, Low Temperature Physics 26, 171 (2000).
- Zakharov et al. (1998) A. A. Zakharov, A. A. Nikonov, and O. E. Parfionov, Phys. Rev. B 57, R3233 (1998).
- Töpfer and Goodenough (1997) J. Töpfer and J. B. Goodenough, J. Solid State Chem. 130, 117 (1997).
- Kavano et al. (1996) H. Kavano, R. Kajimoto, M. Kubota, and H. Yoshizawa, Phys. Rev. B 53, R14709 (1996).
- Urushibara et al. (1995) A. Urushibara, Y. Morimoto, T. Arima, A. Asamitsu, G. Kido, and Y. Tokura, Phys. Rev. B 51, 14103 (1995).
- Mitchell et al. (1996) J. F. Mitchell, D. N. Argyriou, C. D. Potter, D. G. Hinks, J. D. Jorgensen, and S. D. Bader, Phys. Rev. B 54, 6172 (1996).
- Hauback et al. (1996) B. C. Hauback, H. Fjellvåg, and N. Sakai, J. Solid State Chem. 124, 43 (1996).
- Huang et al. (1997) Q. Huang, A. Santoro, J. W. Lynn, R. W. Erwin, J. A. Borchers, J. L. Peng, and R. L. Greene, Phys. Rev. B 55, 14987 (1997).
- Iliev et al. (1998) M. N. Iliev, M. V. Abrashev, H.-G. Lee, V. N. Popov, Y. Y. Sun, C. Thomsen, R. L. Meng, and C. W. Chu, Phys. Rev. B 57, 2872 (1998).
- Iliev et al. (2003) M. N. Iliev, M. V. Abrashev, V. N. Popov, and V. G. Hadjiev, Phys. Rev. B 67, 212301 (2003).
- Paolone et al. (2000) A. Paolone, P. Roy, A. Pimenov, A. Loidl, O. K. Mel’nikov, and A. Y. Shapiro, Phys. Rev. B 61, 11255 (2000).
- Jung et al. (1998) J. H. Jung, K. H. Kim, T. W. Noh, E. J. Choi, and J. Yu, Phys. Rev. B 57, R11043 (1998).
- Abrashev et al. (1999) M. V. Abrashev, A. P. Litvinchuk, M. N. Iliev, R. L. Meng, V. N. Popov, V. G. Ivanov, R. A. Chakalov, and C. Thomsen, Phys. Rev. B 59, 4146 (1999).
- Iliev et al. (2000) M. N. Iliev, A. P. Litvinchuk, M. V. Abrashev, V. G. Ivanov, H. G. Lee, W. H. McCarrol, M. Greenblatt, R. L. Meng, and C. W. Chu, Physica C 341-348, 2257 (2000).
- Kebin et al. (1997) L. Kebin, L. Xijun, Z. Kaigui, Z. Jingsheng, and Z. Yuheng, J. Appl. Phys. 81, 6943 (1997).
- Elemans et al. (1971) J. B. A. A. Elemans, B. van Laar, K. R. van der Veen, and B. O. Loopstra, J. Solid State Chem. 3, 238 (1971).
- Smirnova (1999) I. S. Smirnova, Physica B 262, 247 (1999).
- Koneva et al. (2005) I. E. Koneva, A. V. Dubovitskii, I. G. Naumenko, I. S. Bredikhin, I. N. Burmistrov, G. E. Abrosimova, A. S. Aronin, V. V. Sinitsyn, and S. I. Bredikhin, in Tezisy dokladov konferentsii “Fizicheskie problemy vodorodnoi ènergetiki” (2005), p. 100, in Russian.
- Chaillout et al. (1990) C. Chaillout, J. Chenavas, S. W. Cheong, Z. Fisk, M. Marezio, B. Morozin, and J. E. Schirber, Physica C 170, 87 (1990).
- van Roosmalen and Cordfunke (1994) J. A. M. van Roosmalen and E. H. P. Cordfunke, J. Solid State Chem. 110, 106 (1994).
- Shuker and Gammon (1970) R. Shuker and R. W. Gammon, Phys. Rev. Lett. 25, 222 (1970).
- Qiu et al. (2005) X. Qiu, T. Proffen, J. F. Mitchell, and S. J. L. Billinge, Phys. Rev. Lett. 94, 177203 (2005).
- Shekhtman et al. (2004) V. Sh. Shekhtman, I. S. Smirnova, V. D. Sedykh, I. M. Shmyt’ko, N. S. Afonikova, and A. V. Dubovitskii, Crystallography Reports 49, 40 (2004).
- Lunkenheimer et al. (2003) P. Lunkenheimer, T. Rudolf, J. Hemberger, A. Pimenov, S. Tachos, F. Lichtenberg, and A. Loidl, Phys. Rev. B 68, 245108 (2003).
- Tsvetkov et al. (2004) A. A. Tsvetkov, F. P. Mena, P. H. M. van Loosdrecht, D. van der Marel, Y. Ren, A. A. Nugroho, A. A. Menovsky, I. S. Elfimov, and G. A. Sawatzky, Phys. Rev. B 69, 075110 (2004).